. 2007 Oct 15;1(1):185-96.
doi: 10.3389/neuro.01.1.1.014.2007. eCollection 2007 Nov.

Spatiotemporal dynamics of word processing in the human brain

Affiliations

Spatiotemporal dynamics of word processing in the human brain

Ryan T Canolty et al. Front Neurosci. .

Abstract

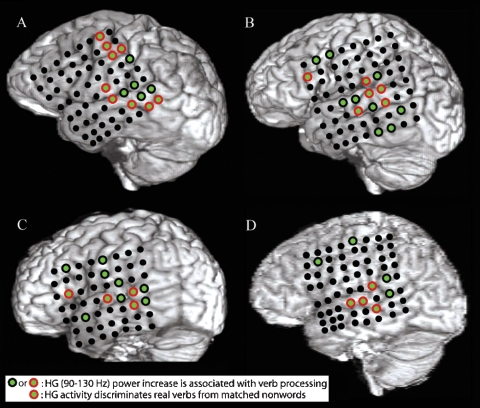
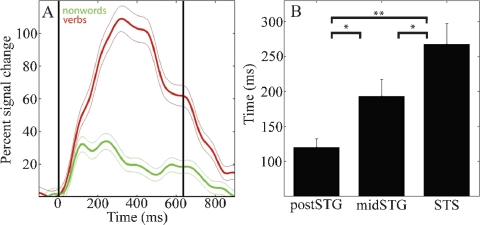
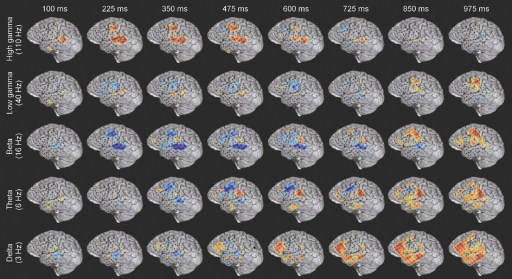
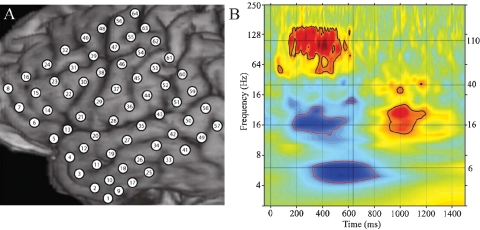
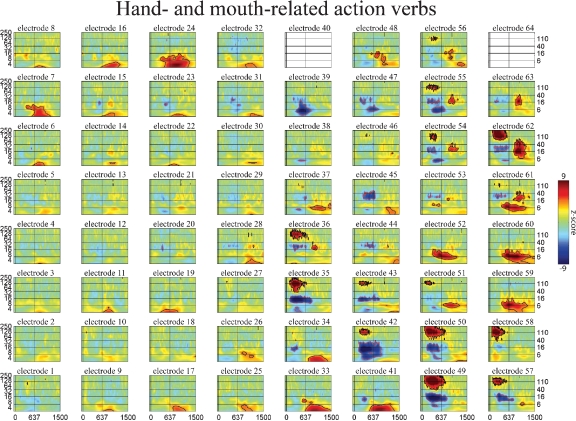
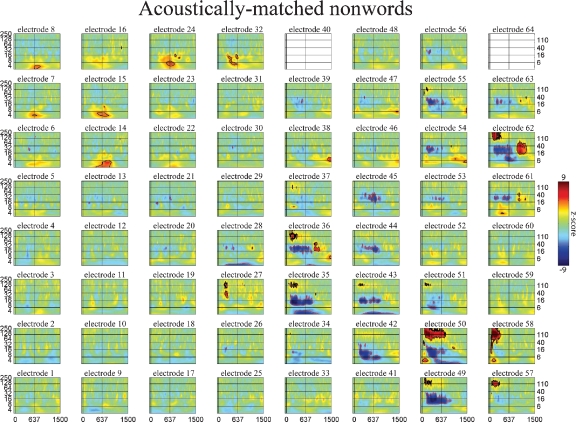
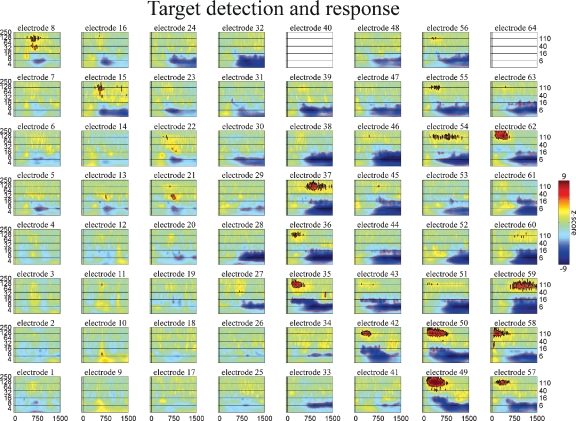
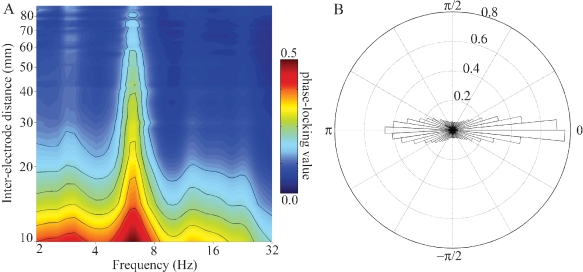
We examined the spatiotemporal dynamics of word processing by recording the electrocorticogram (ECoG) from the lateral frontotemporal cortex of neurosurgical patients chronically implanted with subdural electrode grids. Subjects engaged in a target detection task where proper names served as infrequent targets embedded in a stream of task-irrelevant verbs and nonwords. Verbs described actions related to the hand (e.g, throw) or mouth (e.g., blow), while unintelligible nonwords were sounds which matched the verbs in duration, intensity, temporal modulation, and power spectrum. Complex oscillatory dynamics were observed in the delta, theta, alpha, beta, low, and high gamma (HG) bands in response to presentation of all stimulus types. HG activity (80-200 Hz) in the ECoG tracked the spatiotemporal dynamics of word processing and identified a network of cortical structures involved in early word processing. HG was used to determine the relative onset, peak, and offset times of local cortical activation during word processing. Listening to verbs compared to nonwords sequentially activates first the posterior superior temporal gyrus (post-STG), then the middle superior temporal gyrus (mid-STG), followed by the superior temporal sulcus (STS). We also observed strong phase-locking between pairs of electrodes in the theta band, with weaker phase-locking occurring in the delta, alpha, and beta frequency ranges. These results provide details on the first few hundred milliseconds of the spatiotemporal evolution of cortical activity during word processing and provide evidence consistent with the hypothesis that an oscillatory hierarchy coordinates the flow of information between distinct cortical regions during goal-directed behavior.

Keywords: electrocorticogram; gamma; oscillations; superior temporal gyrus; superior temporal sulcus; target detection; verbs; word processing.


Figures

Figure 1
Figure 1
A–D show structural MRI renderings with electrode locations for the four subjects studied. Electrodes that exhibited a significant pre- to post-stimulus increase in HG power following verb presentation are shown with green centers. Electrodes that also showed a greater increase in HG power for presentation of verbs than for presentation of acoustically matched nonwords are outlined in red. Verb processing compared to nonword processing activates a distributed network of cortical areas including the post-STG, the mid-STG, and the STS.
Figure 2
Figure 2
(A) Mean (±SE) percent signal change of HG analytic amplitude for verbs (red) and nonwords (green) for an electrode over the STS in patient A (49, see Figure 4A for location). Black vertical lines indicate onset and offset of verb stimulus. (B) Processing of words as opposed to acoustically matched nonwords sequentially activates the post-STG, then the mid-STG, followed by the STS. Mean (±SE) onset time of significantly different HG activity for words versus acoustically matched nonwords in post-STG, mid-STG, and STS. (*: p < 0.05; **: p < 0.001, FDR corrected). (HG, 80–200 Hz) is the most effective frequency band for the temporal tracking of cortical activity associated with word processing.
Figure 3
Figure 3
Example of the spatiotemporally complex oscillatory dynamics associated with verb processing. Spatial pattern of power changes in different frequency bands at successive times in response to verb presentation in subject A (see Figure 4A for electrode locations on MRI rendering and methods for MNI coordinates). Red indicates power increase and blue indicates power decrease. HG activity along the STG and STS has an early, strong onset, and in this subject is accompanied by activation of premotor regions. An initial beta power decrease occurs at and surrounding regions of strong HG activity, but note the late (850–975 ms) beta power increase over motor areas. Theta power shows a transient power decrease over premotor/frontal areas (350–725 ms) and a late onset power increase over the inferior parietal lobule (e.g., 600–975 ms). Delta activity is late and spatially diffuse over prefrontal and middle temporal regions. Note that power changes in different frequency bands are active in overlapping but distinct cortical territories, and show distinct temporal patterns of onset, duration, and offset.
Figure 4
Figure 4
(A) Close-up of structural MRI for subject A showing numbered electrode positions (see also Figure 1A for same subject). See methods for MNI coordinates. (B) Event-related time–frequency plot for ECoG response at electrode 55 (premotor region) following verb presentation. Verb onset (0 ms) and offset (637 ms) are marked by solid black vertical lines. Black horizontal lines mark frequencies of interest (6, 16, 40, and 110 Hz) which are shown in Figure 3. Note strong HG (∼110 Hz, HG) power increase (red), initial beta (∼16 Hz) power decrease (blue) followed by very late beta increase, and late theta (∼6 Hz) power decrease. Outermost black (red) contour line indicates significant power increase (decrease) (p < 0.001, FDR corrected).
Figure 5
Figure 5
Event-related time–frequency plots for all electrodes in subject A in response to presentation of verbs. See Figure 4A and methods for electrode locations. Vertical lines indicate stimulus onset and offset. Horizontal lines indicated frequencies of interest (theta, beta, low gamma, and HG). Outermost black (red) contour line indicates significant power increase (decrease) (p < 0.001, FDR corrected). Note that some electrodes show a similar HG response to all auditory stimuli (e.g., 58 over STG), while the HG response of others depends on linguistic category (verbs and names vs. nonwords, e.g., 49 over STS or 55 over premotor areas) or task demands (targets vs. distractors, e.g., 8 and 15 over prefrontal cortex). Other bands also exhibit stimulus specificity: e.g., theta at 59 over the inferior parietal lobule, or delta at 41 over middle temporal gyrus. (c.f. Figures 6 and 7).
Figure 6
Figure 6
Event-related time-frequency plots for all electrodes in subject A in response to presentation of acoustically matched (unintelligible) nonwords. See Figure 4A and methods for electrode locations. Vertical lines indicate stimulus onset and offset. Horizontal lines indicated frequencies of interest (theta, beta, low gamma, and HG). Outermost black (red) contour line indicates significant power increase (decrease) (p < 0.001, FDR corrected). See also legend for Figure 5.
Figure 7
Figure 7
Event-related time–frequency plots for all electrodes in subject A in response to presentation of proper names (targets in target detection task). Note HG activity in electrodes 8 and 15 over prefrontal cortex. See Figure 4A and methods for electrode locations. Vertical lines indicate stimulus onset and offset. Horizontal lines indicated frequencies of interest (theta, beta, low gamma, and HG). Outermost black (red) contour line indicates significant power increase (decrease) (p < 0.001, FDR corrected). See also legend for Figure 5.
Figure 8
Figure 8
(A) Mean PLV as a function of frequency and inter-electrode distance for all pairs of electrodes in subject A. Larger PLVs indicate that pairs of electrodes exhibit a greater degree of phase coherence at that frequency. Note that for all inter-electrode distances the strongest phase coherence occurs in the theta (4–8 Hz) band, with smaller peaks occurring in the delta (2–4 Hz), alpha (8–12 Hz), and beta (12–30 Hz) bands. Outermost contour line indicates a PLV of 0.15; other contours indicate steps of 0.05. (B) Normalized polar histogram of preferred phase differences between electrode pairs for all frequencies and inter-electrode distances in subject A. Note that phase differences are clustered around 0 degree (in phase) and 180 degree (out of phase). This has implications for the ease of communication between areas (see Discussion).

References

    1. Bartos M., Vida I., Jonas P. (2007). Synaptic mechanisms of synchronized gamma oscillations in inhibitory interneuron networks. Nat. Rev. Neurosci. 8, 45–56 10.1038/nrn2044 - DOI - PubMed
    1. Belin P., Zatorre R. J., Ahad P. (2002). Human temporal-lobe response to vocal sounds. Cogn. Brain Res. 13, 17–26 10.1016/S0926-6410(01)00084-2 - DOI - PubMed
    1. Binder J. R., Frost J. A., Hammeke T. A., Bellgowan P. S., Sprinker J. A., Kaufman J. N., Possing E. T. (2000). Human temporal lobe activation by speech and nonspeech sounds. Cereb. Cortex 10, 512–528 10.1093/cercor/10.5.512 - DOI - PubMed
    1. Binder J. R., Frost J. A., Hammeke T. A., Cox R. W., Rao S. M., Prieto T. (1997). Human brain language areas identified by functional magnetic resonance imaging. J. Neurosci. 17, 353–362 - PMC - PubMed
    1. Binder J. R., Rao S. M., Hammeke T. A., Yetkin F. Z., Jsmanowicz A., Bandettini P. A., Wong E. C., Estkowski L. D., Goldstein M. D., Haughton V. M., Hyde J. S. (1994). Functional magnetic resonance imaging of human auditory cortex. Ann. Neurol. 35, 662–672 10.1002/ana.410350606 - DOI - PubMed

LinkOut - more resources