. 2008 Oct 31;135(3):437-48.
doi: 10.1016/j.cell.2008.08.041.

Nf1-dependent tumors require a microenvironment containing Nf1+/-- and c-kit-dependent bone marrow

Affiliations

Nf1-dependent tumors require a microenvironment containing Nf1+/-- and c-kit-dependent bone marrow

Feng-Chun Yang et al. Cell. .

Abstract

Interactions between tumorigenic cells and their surrounding microenvironment are critical for tumor progression yet remain incompletely understood. Germline mutations in the NF1 tumor suppressor gene cause neurofibromatosis type 1 (NF1), a common genetic disorder characterized by complex tumors called neurofibromas. Genetic studies indicate that biallelic loss of Nf1 is required in the tumorigenic cell of origin in the embryonic Schwann cell lineage. However, in the physiologic state, Schwann cell loss of heterozygosity is not sufficient for neurofibroma formation and Nf1 haploinsufficiency in at least one additional nonneoplastic lineage is required for tumor progression. Here, we establish that Nf1 heterozygosity of bone marrow-derived cells in the tumor microenvironment is sufficient to allow neurofibroma progression in the context of Schwann cell Nf1 deficiency. Further, genetic or pharmacologic attenuation of c-kit signaling in Nf1+/- hematopoietic cells diminishes neurofibroma initiation and progression. Finally, these studies implicate mast cells as critical mediators of tumor initiation.


Figures

Figure 1
Figure 1. Strategy to Examine the Role of the Hematopoietic Microenvironment in Neurofibroma Formation
(A) Experimental design; schematic showing the genotypes of recipient mice, the genotypes of bone marrow cells following ionizing radiation of recipients, and measurements obtained following transplantation. (B) Identification of donor bone marrow using fluorescence cytometry. Representative histograms of donor bone marrow cells isolated from previously irradiated Krox20;Nf1flox/flox recipients. The genotypes of transplanted cells are indicated. Dotted lines indicate the EGFP fluorescence intensity of bone marrow that lacks the EGFP transgene.
Figure 2
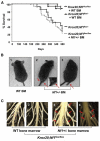
Figure 2. Nf1+/− Bone Marrow Is Necessary for Plexiform Neurofibroma Formation in Krox20;Nf1flox/flox and Krox20;Nf1flox/− Mice
(A) Previously irradiated Krox20;Nf1flox/flox and Krox20;Nf1flox/− mice transplanted with Nf1+/− or WT bone marrow were followed until 1 year of age. A Kaplan-Meier plot of percent survival (y axis) as a function of time (x axis) is shown. The genotypes are indicated. Comparisons of Krox20;Nf1flox/flox+ Nf1+/− BM (dashed line) versus Krox20;Nf1flox/flox+ WT BM (open squares) (p < 0.002); Krox20;Nf1flox/flox+ Nf1+/− BM (dashed line) versus Krox20;Nf1flox/− (open circles) (no significant difference). Krox20;Nf1flox/− (open circles) versus Krox20;Nf1flox/− + WT bone marrow (closed squares) (p < 0.0002). (B) Photographs of Krox20;Nf1flox/flox mice transplanted with WT BM (1) or Nf1+/− BM (2 and 3). Arrowheads identify limbs with motor paralysis. (C) Dissections of dorsal root ganglia and peripheral nerves of Krox20;Nf1flox/flox mice transplanted with WT or Nf1+/− bone marrow. Arrowheads identify tumors in dorsal root ganglia and proximal peripheral nerves.
Figure 3
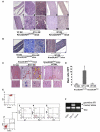
Figure 3. Tumors Isolated from Krox20;Nf1flox/flox Mice Transplanted with Nf1+/− Bone Marrow Have Histologic Features of Plexiform Neurofibromas
(A) Hematoxylin and eosin (H&E) sections of dorsal root ganglia and proximal peripheral nerves. Panels 1 and 6 are sections from a Krox20;Nf1flox/flox mouse transplanted with WT BM. Panels 2, 3, 7, and 8 are from Krox20;Nf1flox/flox mice transplanted with Nf1+/− BM. Panels 4, 5, 9, and 10 are from Krox20;Nf1flox/− mice transplanted with WT BM. Photos in upper panels were taken with a light microscope under 100x, whereas the lower panels were taken under 400x. (B) 200x magnification of sections stained with Masson's trichrome. Genotypes of donor bone marrow and recipient mice are indicated. (C) 200x magnification of sections stained with alcian blue. Red arrowheads identify mast cells. Yellow arrowheads identify blood vessels. High power magnification (1000x) insets of mast cells are indicated. (D) Summary data indicating the number of mast cells scored within tumors or dorsal root ganglia (DRG) of Krox20;Nf1flox/flox and Krox20;Nf1flox/− recipients. Data represent the mean ± standard error of the mean (SEM) of five tumors or DRG per group. The genotypes of the donors and recipient mice are indicated. An asterisk indicates p < 0.001 significance of mast cells identified in recipients who received Nf1+/− versus WT bone marrow. (E) Phenotypic evaluation of bone marrow-derived lineages using fluorescence cytometry. Bone marrow (panel 1) and tumor cells (panel 2) were isolated and sorted for EGFP+; CD45.2 positive populations. Tumor associated CD45.2 cells were then further separated to identify mast cell (panel 3), macrophage (panel 4), B-lymphocyte (panel 4), and T-lymphocyte populations (panel 5). The proportion of each hematopoietic cell population within the tumor is indicated. (F) Genotyping of lineages isolated by FACS from tumors of Krox20;Nf1flox/flox mice transplanted with Nf1+/− BM. Arrows identify the amplified DNA products of the indicated alleles from the respective phenotypic lineages.
Figure 4
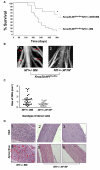
Figure 4. Genetic Disruption of c-kit in Adoptively Transferred Nf1+/− Bone Marrow Prevents the Genesis of Plexiform Neurofibromas in Recipient Krox20;Nf1flox/flox Mice
(A) Krox20;Nf1flox/flox mice were transplanted with Nf1+/− or Nf1+/−;W mutant BM. A Kaplan-Meier plot of percent survival (y axis) as a function of time (x axis) is shown. The genotypes are indicated. An asterisk indicates p < 0.002 comparing survival of the two experimental groups. (B) Photographs of the spinal cord and dorsal roots of Krox20;Nf1flox/flox mice transplanted with WT BM (panel 1) or Nf1+/− BM (panel 2). Arrows identify tumors in proximal nerves. (C) Mean size of dorsal root ganglia (DRG) from the sciatic nerves of recipients transplanted with Nf1+/− or Nf1+/−;W/W bone marrow. Each dot represents the size of an individual DRG. The line indicates the mean size of all DRG. An asterisk indicates p < 0.01 comparing size of DRG between two groups. (D) Representative histologic sections of dorsal root ganglia and proximal spinal nerves of Krox20;Nf1flox/flox mice transplanted with Nf1+/− or Nf1+/−;W/W mutant marrow. Panels 1–3 are sections stained with H&E; panels 4–6 are stained with alcian blue. Arrowheads indicate mast cells. The genotypes of donor bone marrow are indicated.
Figure 5
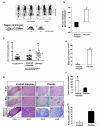
Figure 5. Treatment of Krox20;Nf1flox/− Mice with Imatinib Mesylate
(A) Change in mean FDG-PET-positive tumors after a 12 week treatment with imatinib mesylate. The temporal sequence of scans in three individual mice, and the experimental treatment groups are identified (panels1–6). A schematic identifying a high resolution region of interest and representative regions of interest prior and subsequent to treatment with imatinib mesylate are shown (panels 7 and 8). (B) Summary of changes in mean FDG-PET intensity after a 12 week treatment with imatinib mesylate or PBS. Data are presented as mean ± SEM. (C) Dissection of the peripheral nerves. Mean volume of dorsal root ganglia from all sciatic nerves of Krox20;Nf1flox/− mice treated with vehicle versus imatinib mesylate. The solid line indicates mean volume of each respective group. Each symbol indicates the volume of an individual nerve. *p < 0.001 comparing vehicle to imatinib mesylate. (D) Histological analysis of the Krox20;Nf1flox/− mice treated with imatinib mesylate or vehicle. Representative sections were shown following H&E staining, Alcian blue staining, and Masson's trichrome staining. The experimental therapy, the stains utilized to prepare the specimens, and the magnification are indicated. Red arrows identify mast cells found on the respective sections. (E) Imatinib mesylate reduces mast cell numbers in plexiform neurofibromas. Summary data of mast cells per 100× field of Krox20;Nf1flox/− mice treated with imatinib mesylate or vehicle. Data represent mean ± SEM of mast cells/ high power field from 10 fields of 12 tumors/DRG; an asterisk indicates p < 0.01 statistical difference between groups. (F and G) Imatinib mesylate induces apoptosis (F) and reduces proliferation (G) in plexiform neurofibromas. Summary data (mean ± SEM) of (F) apoptotic and (G) BrdU+ cells / high power field imatinib mesylate versus placebo; an asterisk indicates p < 0.01 statistical difference between groups.
Figure 6
Figure 6. Evaluation of Imatinib Mesylate Efficacy in an Index Patient with a Plexiform Neurofibroma
Coronal MRI scans (T1 weighted images with gadolinium contrast and fat saturation) of the head and oropharynx of an NF1 patient with a plexiform neurofibroma before (panel 1) and 3 months following treatment with imatinib mesylate (panel 2). The region of the tumor in the respective images is indicated.

Comment in

Similar articles

Cited by

References

    1. Bergers G, Brekken R, McMahon G, Vu TH, Itoh T, Tamaki K, Tanzawa K, Thorpe P, Itohara S, Werb Z, Hanahan D. Matrix metalloproteinase-9 triggers the angiogenic switch during carcinogenesis. Nat. Cell Biol. 2000;2:737–744. - PMC - PubMed
    1. Bhowmick NA, Chytil A, Plieth D, Gorska AE, Dumont N, Shappell S, Washington MK, Neilson EG, Moses HL. TGF-beta signaling in fibroblasts modulates the oncogenic potential of adjacent epithelia. Science. 2004;303:848–851. - PubMed
    1. Boesiger J, Tsai M, Maurer M, Yamaguchi M, Brown LF, Claffey KP, Dvorak HF, Galli SJ. Mast cells can secrete vascular permeability factor/ vascular endothelial cell growth factor and exhibit enhanced release after immunoglobulin E-dependent upregulation of fc epsilon receptor I expression. J. Exp. Med. 1998;188:1135–1145. - PMC - PubMed
    1. Bollag G, McCormick F. Differential regulation of rasGAP and neurofibromatosis gene product activities. Nature. 1991;351:576–579. - PubMed
    1. Chang T, McGrae JD, Jr., Hashimoto K. Ultrastructural study of two patients with both piebaldism and neurofibromatosis 1. Pediatr. Dermatol. 1993;10:224–234. - PubMed

Publication types

MeSH terms