. 2008 Oct 31;135(3):449-61.
doi: 10.1016/j.cell.2008.08.035.

The growth factor environment defines distinct pluripotent ground states in novel blastocyst-derived stem cells

Affiliations

The growth factor environment defines distinct pluripotent ground states in novel blastocyst-derived stem cells

Yu-Fen Chou et al. Cell. .

Abstract

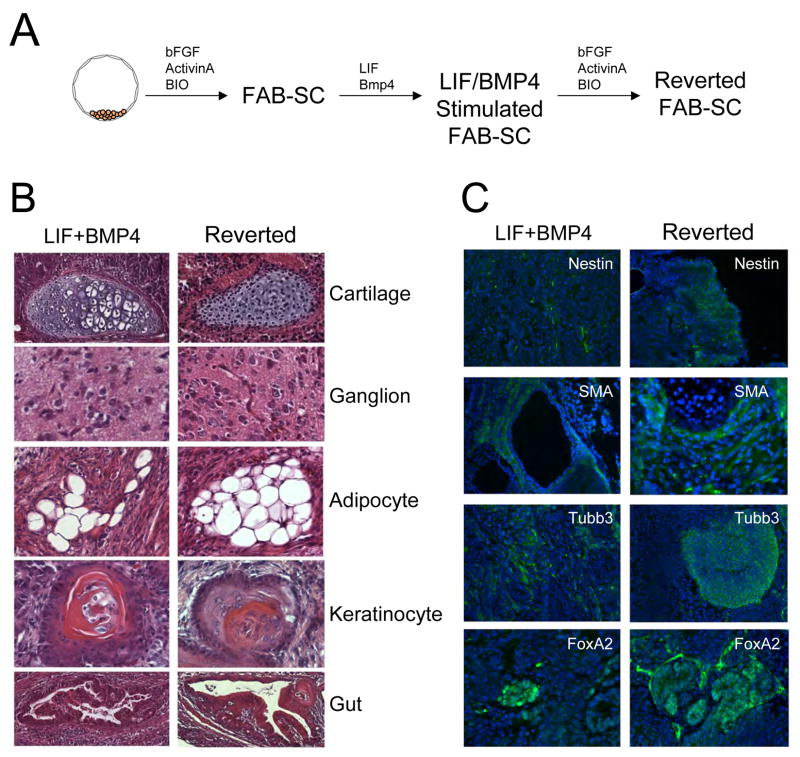
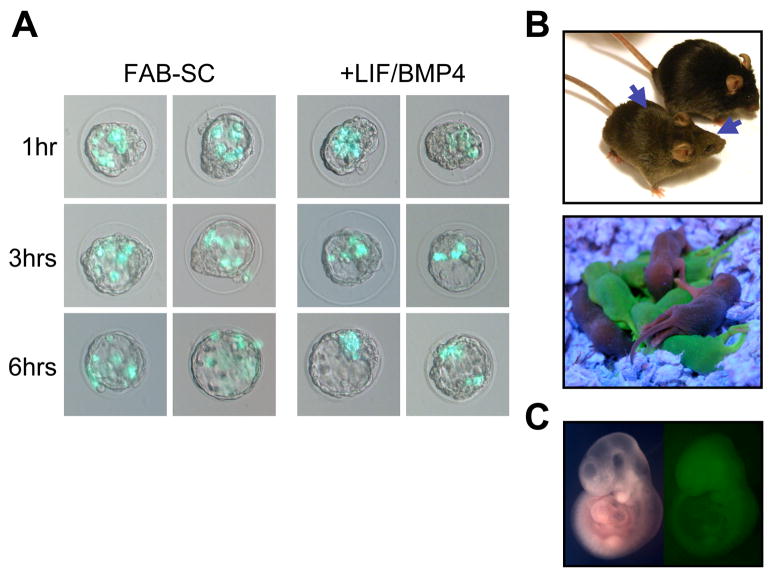
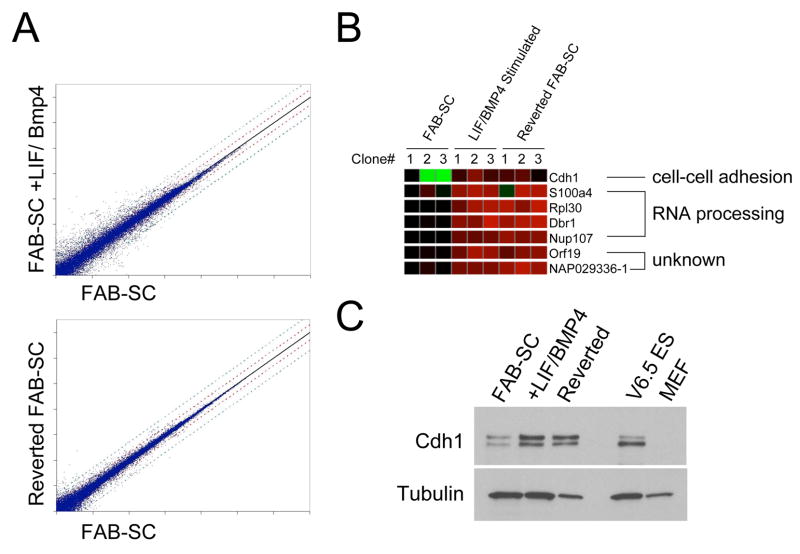
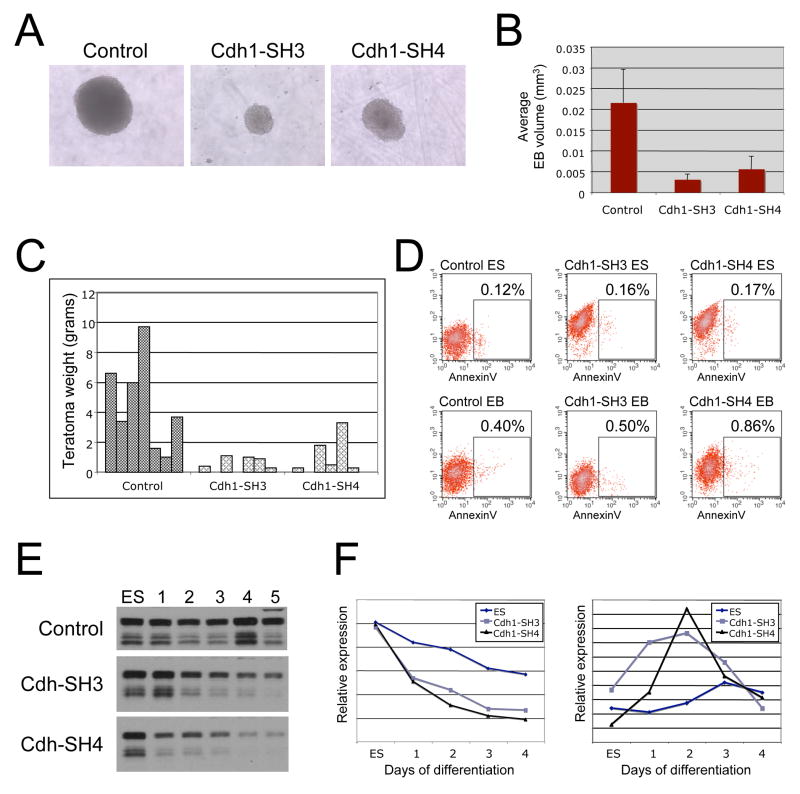
Pluripotent stem cell lines can be derived from blastocyst embryos, which yield embryonic stem cell lines (ES cells), as well as the postimplantation epiblast, which gives rise to epiblast stem cell lines (EpiSCs). Remarkably, ES cells and EpiSCs display profound differences in the combination of growth factors that maintain their pluripotent state. Molecular and functional differences between these two stem cell types demonstrate that the tissue of origin and/or the growth factor milieu may be important determinants of the stem cell identity. We explored how developmental stage of the tissue of origin and culture growth factor conditions affect the stem cell pluripotent state. Our findings indicate that novel stem cell lines, with unique functional and molecular properties, can be generated from murine blastocyst embryos. We demonstrate that the culture growth factor environment and cell-cell interaction play a critical role in defining several unique and stable stem cell ground states.


Figures

Figure 1
Figure 1. Blastocyst-derived stem cells (FAB-SC)
FAB-SCs were derived as described in the results section. A: Brightfield image of FAB-SCs (Top panel) and mES cells (bottom panel) B: Q-PCR expression analysis of Oct4, Sox2 and Nanog expression on FAB-SC and ES cell as indicated. C: Left panels: Immunofluorescence staining of FAB-SCs for Oct4, Sox2 and Nanog as indicated. Right panels: DAPI nuclear staining. D. Hierarchy clustering of MicroRNA profiles of MEF, mES, EpiSC and FAB-SC cell lines. E. Normalized expression intensity values (scaled median ratio) were obtained from Agilent whole-genome microarrays. Three biological replicates were used for all three cell types.
Figure 2
Figure 2. LIF and BMP4 stimulate FAB-SC teratoma formation
A: Schematic representation of FAB-SC derivation (with bFGF/ActivinA and BIO), LIF/BMP4 stimulated FAB-SCs cultured in the presence of LIF and BMP4 and Reverted FAB-SCs which are again maintained in bFGF/ActivinA and BIO B. H&E staining of teratomas generated from a clonal FAB-SC line stimulated with LIF/BMP4 (Left panels) or stimulated and subsequently cultured for 7 days in FAB-SC conditions (Right panels). Derivatives of all three germ layers are observed as indicated. C: Immunohistochemistry analysis of markers of ectoderm (Nestin, Tubulin β3 (Tubb3)), mesoderm (Smooth Muscle Actin, (SMA) or endoderm (FoxA2).
Figure 3
Figure 3. Growth factor stimulation induces FAB-SC chimera formation and germline contribution
A Temporal analysis of the integration of GFP-transgenic FAB-SC before and after LIF/BMP4 stimulation into recipient blastocysts. Integration of FAB-SCs and LIF/BMP4 stimulated FAB-SCs was monitored at 1, 3 and 6 hours after injection as indicated. B: Top panel, high contribution chimera derived from LIF/BMP4 stimulated FAB-SC (48 hr stimulation). Middle panel: GFP+ offspring of the FAB-SC chimera, demonstrating germline transmission. Bottom panel: Chimera from clonal FAB-SCs stimulated for 7 days with LIF/BMP4; arrows indicate agouti coat color chimerism.
Figure 4
Figure 4. E-Cadherin (Cdh1) is induced by LIF/BMP4 stimulation of FAB-SC
A: microarray comparison of gene expression of FAB-SC and LIF/BMP4 stimulated FAB-SC (Upper panel) or FAB-SC and growth factor reversed FAB-SC (Lower panel). B. Heatmap of genes permanently upregulated by LIF/BMP4 stimulation of FAB-SC. C: Western blot analysis of E-Cadherin expression in FAB-SC, LIF/BMP4 stimulated FAB-SC and growth factor reverted FAB-SC.
Figure 5
Figure 5. E-Cadherin regulates FAB-SC pluripotency
A FAB-SCs constitutively expressing a GFP transgene were transduced with control vector or shRNA to knock down E-Cadherin. A tdTomato reporter gene was co-expressed from the lentiviral shRNA vector to allow identification of knockdown cells. Cdh1-knockdown results in FAB-SC differentiation, middle top panel, arrowhead. B. FAB-SCs were transduced with either control vector or Cdh1 expression vector and 1 × 10⁶ cells were injected subcutaneously into NOD-SCID mice. Tumors were analyzed for germlayer differentiation 1 month after injection of the cells. Top panels: H&E staining of teratomas generated from Cdh1-FAB-SCs. I: Keratinocyte, II: Adipocyte, III: Gut. Lower panels: Immunohistochemistry analysis of markers of IV: Nestin, ectoderm, V: Smooth Muscle Actin, mesoderm and VI: FoxA2, endoderm.
Figure 6
Figure 6. Loss of E-Cadherin expression compromises EB- and teratoma formation by accelerating ES cell differentiation
A: Representative images demonstrating EB differentiation of wild type and E-Cadherin knockdown ES cells. Loss of Cadherin expression results in small EB size compared to the wild-type EBs. B: Bar-graph analysis of the size of Wild-type or E-Cadherin knockdown EBs C: The effect of loss of E-Cadherin expression on teratoma formation. Plotted is the weight (in grams) of seven teratomas of wild-type and seven each of two independent E-Cadherin knockdown ES cell lines. Loss of E-Cadherin results in a profound reduction in teratoma size. D: Analysis of apoptotic frequency in control and E-Cadherin knockdown cells. Stable ES cell lines transduced with control vector or two independent E-Cadherin knockdown hairpins were analyzed by flow cytometry for AnnexinV staining. The ES cells expressed a tdTomato fluorescent reporter gene to distinguish them from the MEF feeder cells. Top panels: AnnexinV-FITC staining of control and two E-Cadherin knockdown ES cell lines. The percentage of AnnexinV-positive cells in indicated. Bottom panels: AnnexinV staining of the same cell lines after 7 days of monolayer differentiation of the cells. E: E-Cadherin downregulation results in early loss of Nanog expression and premature upregulation of HoxB1. Western-blot analysis of Nanog protein expression during differentiation of control ES cells (top) and two independent E-Cadherin knockdown ES cell lines (middle and lower panels). Numbers indicate days of differentiation. F: Left: Q-PCR analysis of the Nanog RNA levels in the same samples. Right: Q-PCR analysis of HoxB1 expression in the same samples.

References

    1. Aoi T, Yae K, Nakagawa M, Ichisaka T, Okita K, Takahashi K, Chiba T, Yamanaka S. Generation of Pluripotent Stem Cells from Adult Mouse Liver and Stomach Cells. Science 2008 - PubMed
    1. Boyer LA, Lee TI, Cole MF, Johnstone SE, Levine SS, Zucker JP, Guenther MG, Kumar RM, Murray HL, Jenner RG, et al. Core transcriptional regulatory circuitry in human embryonic stem cells. Cell. 2005;122:947–956. - PMC - PubMed
    1. Boyer LA, Plath K, Zeitlinger J, Brambrink T, Medeiros LA, Lee TI, Levine SS, Wernig M, Tajonar A, Ray MK, et al. Polycomb complexes repress developmental regulators in murine embryonic stem cells. Nature. 2006;441:349–353. - PubMed
    1. Brons IG, Smithers LE, Trotter MW, Rugg-Gunn P, Sun B, Chuva de Sousa Lopes SM, Howlett SK, Clarkson A, Ahrlund-Richter L, Pedersen RA, et al. Derivation of pluripotent epiblast stem cells from mammalian embryos. Nature. 2007;448:191–195. - PubMed
    1. Carpenter MK, Rosler ES, Fisk GJ, Brandenberger R, Ares X, Miura T, Lucero M, Rao MS. Properties of four human embryonic stem cell lines maintained in a feeder-free culture system. Dev Dyn. 2004;229:243–258. - PubMed

Publication types

Substances