. 2008 Oct 31;135(3):561-71.
doi: 10.1016/j.cell.2008.08.040.

Anatomical profiling of G protein-coupled receptor expression

Affiliations

Anatomical profiling of G protein-coupled receptor expression

Jean B Regard et al. Cell. .

Abstract

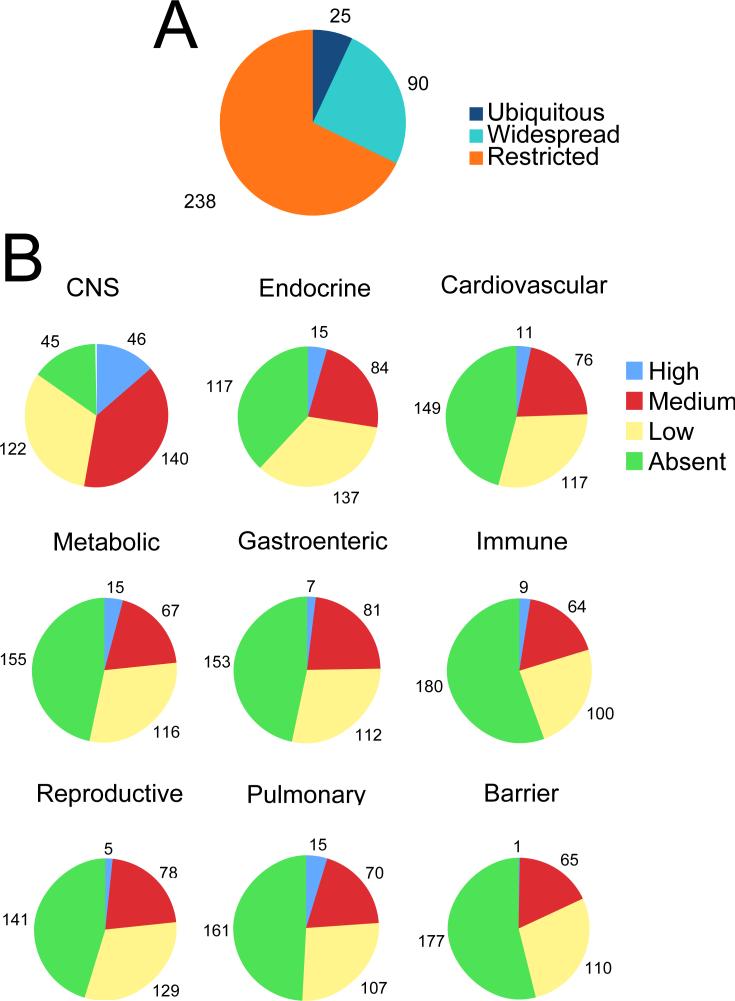
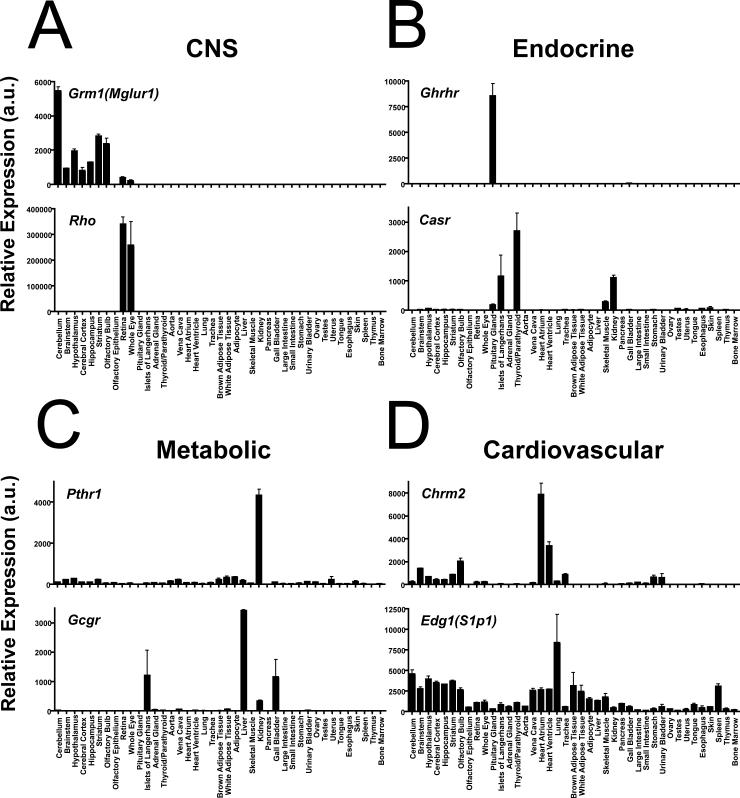
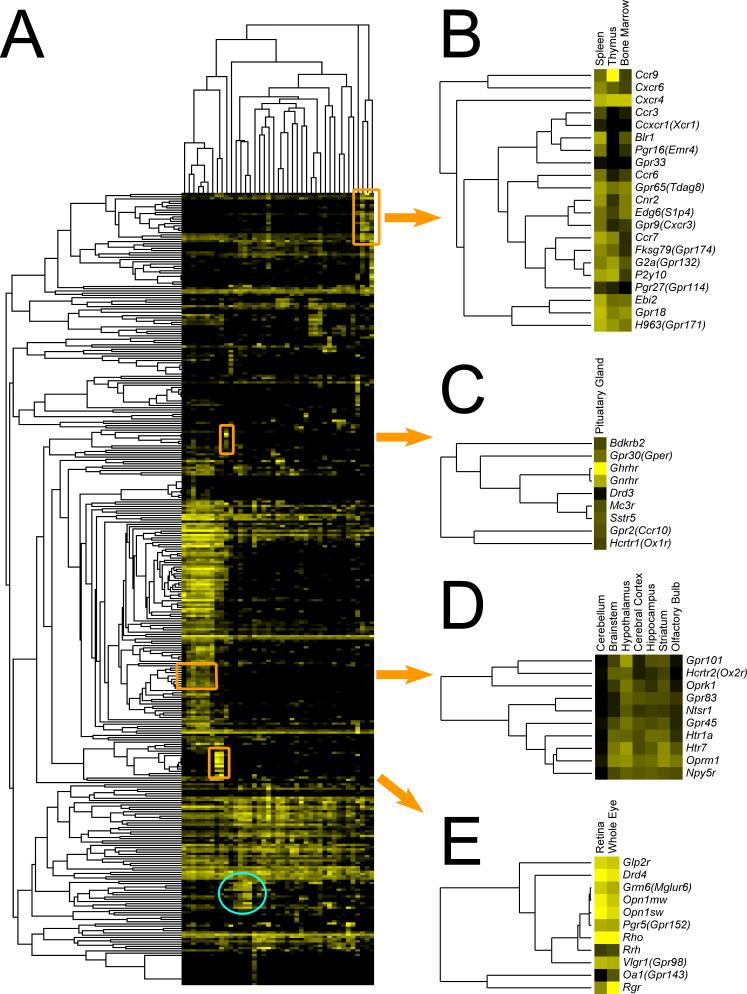
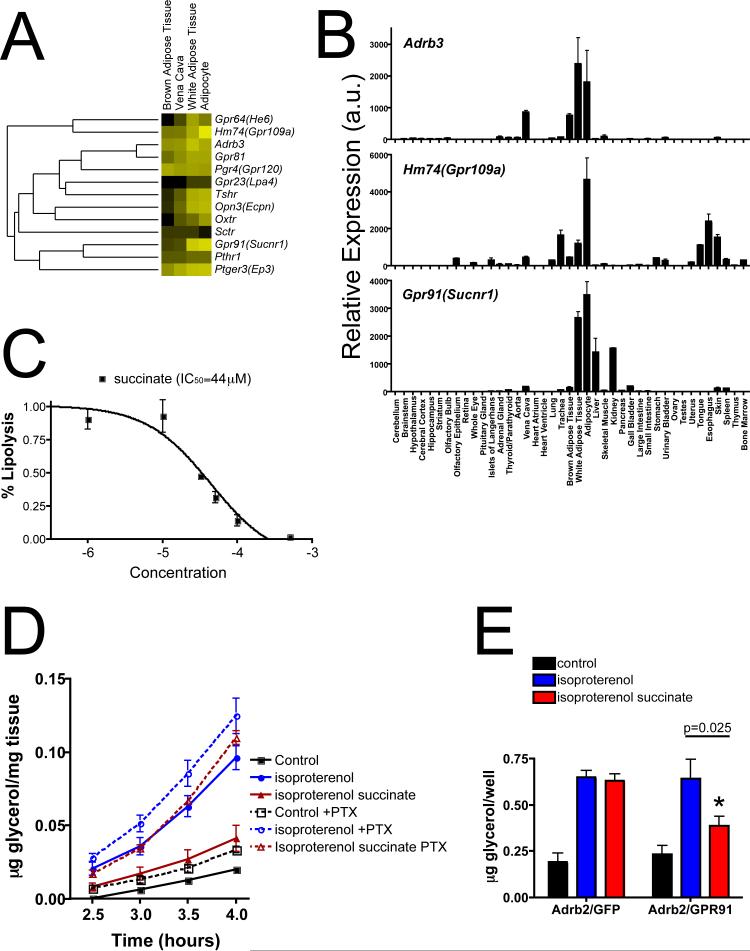
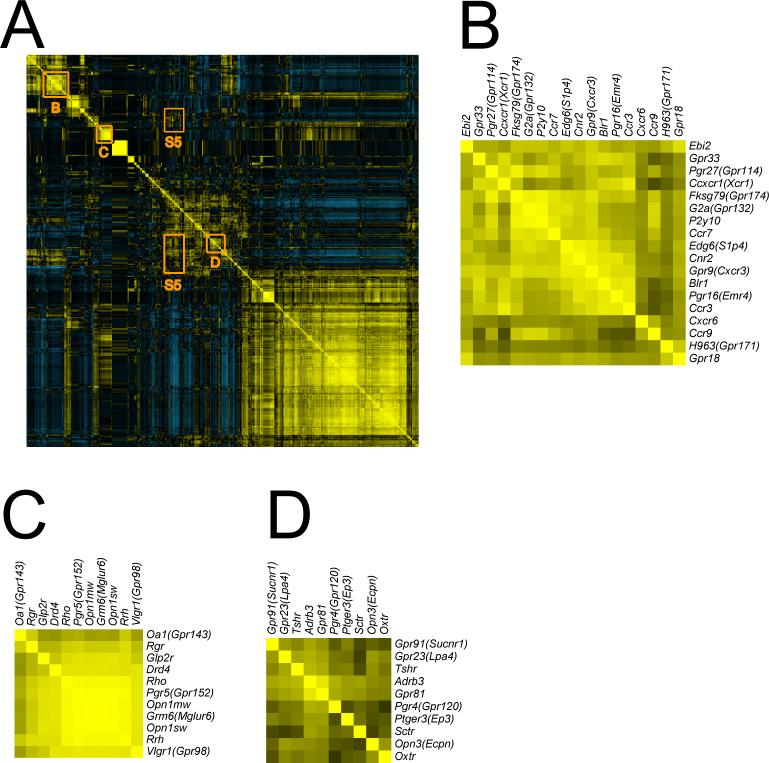
G protein-coupled receptors (GPCRs) comprise the largest family of transmembrane signaling molecules and regulate a host of physiological and disease processes. To better understand the functions of GPCRs in vivo, we quantified transcript levels of 353 nonodorant GPCRs in 41 adult mouse tissues. Cluster analysis placed many GPCRs into anticipated anatomical and functional groups and predicted previously unidentified roles for less-studied receptors. From one such prediction, we showed that the Gpr91 ligand succinate can regulate lipolysis in white adipose tissue, suggesting that signaling by this citric acid cycle intermediate may regulate energy homeostasis. We also showed that pairwise analysis of GPCR expression across tissues may help predict drug side effects. This resource will aid studies to understand GPCR function in vivo and may assist in the identification of therapeutic targets.


Figures

Fig. 1
Fig. 1. Distribution of mouse GPCR mRNA expression in vivo
A) The number of GPCRs expressed in tissues presented in pie chart form. Receptors expressed in all 41 tissues assayed are “ubiquitous”; receptors expressed in more than or less than half are “widespread” or “restricted”, respectively. A list of the “ubiquitous” receptors is included in Table 1. B) GPCR expression by tissue systems. High, medium, low and absent are defined in Results. Tissue systems are defined as: Central Nervous System (CNS: cerebellum, brainstem, hypothalamus, cerebral cortex, hippocampus, striatum, olfactory bulb, olfactory epithelium, retina, whole eye), Endocrine (pituitary gland, islets of Langerhans, adrenal gland, thyroid/parathyroid), Cardiovascular (aorta, vena cava, heart atrium, heart ventricle), Pulmonary (lung, trachea), Metabolic (brown adipose tissue, white adipose tissue, isolated adipocytes, liver, skeletal muscle, kidney), Gastroenteric (pancreas, gall bladder, large intestine, small intestine, stomach, urinary bladder), Reproductive (ovary, testes, uterus), Barrier (tongue, esophagus, skin) and Immune (spleen, thymus, bone marrow). A list of the highly expressed GPCRs in individual tissue systems is included in Table 1.
Fig. 2
Fig. 2. qRT-PCR tissue distribution yields predicted patterns of expression
Representative GPCRs that were highly expressed in distinct tissue systems were selected from Fig. 1B and Table 1 to illustrate tissue specificity, range of expression levels, and reproducibility. Examples are shown for A) CNS: metabotropic glutamate receptor 1 [Grm1(Mglur1)] and rhodopsin [Rho]. B) Endocrine system: growth hormone releasing hormone receptor [Ghrhr] and the extracellular calcium-sensing receptor [Casr]. C) Metabolic tissues: parathyroid hormone receptor 1 [Pthr1] and glucagon receptor [Gcgr]. D) Cardiovascular system: M2 muscarinic receptor [Chrm2] and the sphingosine-1-phosphate receptor 1 [Edg1(S1p1)]. Values are plotted as the mean ± SEM; n=2−5.
Fig. 3
Fig. 3. Unsupervised hierarchical clustering of GPCR expression across tissues
A) Transformed qRT-PCR data for the 353 GPCRs assayed in the 41 tissues was evaluated by unsupervised hierarchical clustering with average linkage using Cluster 3.0 and visualized using Java TreeView (see Experimental Procedures). A thumbnail image is shown here, a full size version is available in Supplement S3. Multiple clusters and subclusters were seen, 5 were chosen for further analysis. The fifth cluster (blue circle towards the bottom) is discussed in Fig. 4. B) A portion of the “immune/hematopoietic” cluster is shown; note the abundance of chemokine receptors. C) The “pituitary” cluster contains many well-documented regulators of pituitary function, including Ghrhr and Gnrhr. D) A small portion of the “CNS” cluster, by far the largest. This portion contains receptors for important neurotransmitters including serotonin, neuropeptide Y, orexin and opiates. E) The “eye/retinal” cluster contains light-sensing opsins as well as other receptors known to regulate vision.
Fig. 4
Fig. 4. Gpr91(Sucnr1) and its ligand, succinate, can inhibit lipolysis in adipocytes
A) The “adipose” cluster (blue circle, lower part Fig. 3A) contained numerous regulators of adipocyte function. B) Adrb3, Hm74(Gpr109a) and Gpr91(Sucnr1) were expressed at similarly high levels in white adipose tissues (WAT) and isolated adipocytes. C) Isolated WAT was treated with isoproterenol (20nM) to stimulate lipolysis, as measured by glycerol release at 3 hours. Succinate added concurrently with isoproterenol inhibited lipolysis in a concentration-dependent manner with an apparent IC50 of approximately 44μM. D) Isolated WAT was pretreated either with KRH/BSA or KRH/BSA containing pertussis toxin (PTX; 100 ng/mL) for 3 hours prior to exposure to the indicated conditions. Isoproterenol (20nM)-stimulated glycerol release was inhibited by the addition of 80μM succinate. Pretreatment of WAT with PTX abrogated this effect, suggesting succinate's inhibition of lipolysis occurred in a Gi/o-dependent manner, consistent with Gpr91 activation. E) Differentiated 3T3-L1 cells, which do not express Gpr91 mRNA, were transfected with mammalian expression vectors containing β2 adrenergic receptor (Adrb2) and control (green fluorescent protein; GFP) or Adrb2 and GPR91. Succinate (100μM) inhibited isoproterenol (10nM)-induced lipolysis in cells co-transfected with GPR91, but not GFP. The data shown are mean ± SD, n=3; p=0.025, unpaired student's t-test. This experiment was done three times with similar results.
Fig. 5
Fig. 5. Hierarchical-Cluster analysis of pairwise GPCR expression reveals additional levels of interaction
A) Pearson correlation r coefficients were calculated for interactions between each GPCR with all others based on tissue expression patterns. The resulting data set was further analyzed using Cluster 3.0 with complete linkage and visualized using TreeView. A thumbnail image is shown here, a full size image is available in Supplemental S4. Receptors with similar distributions are shown in yellow; distinct distributions are shown in blue; X- and Y-axis are mirror images of one another. The diagonal represents each receptor interacting with itself (perfect similarity in distribution). B) Clustering of receptors by similarity of expression reveals a immune/hematopoietic grouping very similar to that in Fig. 3B; C) an eye/retinal cluster similar to that in Fig. 3E; and D) an adipose cluster similar to that in Fig. 4A. However, analysis of GPCR interaction clusters off the diagonal suggested receptor functions outside of their most obvious physiological roles. This might aid in understanding and predicting on-target drug side effects (see Discussion and supplementary figure S5).

References

    1. Amizuka N, Lee HS, Kwan MY, Arazani A, Warshawsky H, Hendy GN, Ozawa H, White JH, Goltzman D. Cell-specific expression of the parathyroid hormone (PTH)/PTH-related peptide receptor gene in kidney from kidney-specific and ubiquitous promoters. Endocrinology. 1997;138:469–481. - PubMed
    1. Bates B, Zhang L, Nawoschik S, Kodangattil S, Tseng E, Kopsco D, Kramer A, Shan Q, Taylor N, Johnson J, et al. Characterization of Gpr101 expression and G-protein coupling selectivity. Brain Res. 2006;1087:1–14. - PubMed
    1. Benyo Z, Gille A, Bennett CL, Clausen BE, Offermanns S. Nicotinic acid-induced flushing is mediated by activation of epidermal langerhans cells. Mol Pharmacol. 2006;70:1844–1849. - PubMed
    1. Benyo Z, Gille A, Kero J, Csiky M, Suchankova MC, Nusing RM, Moers A, Pfeffer K, Offermanns S. GPR109A (PUMA-G/HM74A) mediates nicotinic acid-induced flushing. J Clin Invest. 2005;115:3634–3640. - PMC - PubMed
    1. Birkenbach M, Josefsen K, Yalamanchili R, Lenoir G, Kieff E. Epstein-Barr virus-induced genes: first lymphocyte-specific G protein-coupled peptide receptors. J Virol. 1993;67:2209–2220. - PMC - PubMed

Publication types