. 2008 Dec 26;283(52):36441-53.
doi: 10.1074/jbc.M805520200. Epub 2008 Nov 4.

Reciprocal modulation of function between the D1 and D2 dopamine receptors and the Na+,K+-ATPase

Affiliations

Reciprocal modulation of function between the D1 and D2 dopamine receptors and the Na+,K+-ATPase

Lisa A Hazelwood et al. J Biol Chem. .

Abstract

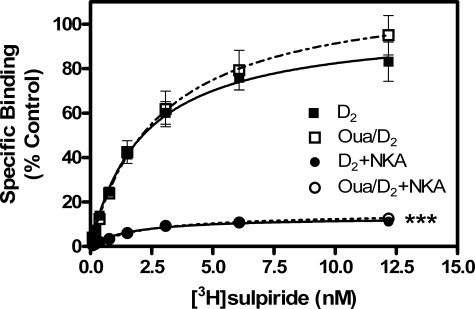
It is well documented that dopamine can increase or decrease the activity of the Na+,K+-ATPase (NKA, sodium pump) in an organ-specific fashion. This regulation can occur, at least partially, via receptor-mediated second messenger activation and can promote NKA insertion or removal from the plasma membrane. Using co-immunoprecipitation and mass spectrometry, we now show that, in both brain and HEK293T cells, D1 and D2 dopamine receptors (DARs) can exist in a complex with the sodium pump. To determine the impact of NKA on DAR function, biological assays were conducted with NKA and DARs co-expressed in HEK293T cells. In this system, expression of NKA dramatically decreased D1 and D2 DAR densities with a concomitant functional decrease in DAR-mediated regulation of cAMP levels. Interestingly, pharmacological inhibition of endogenous or overexpressed NKA enhanced DAR function without altering receptor number or localization. Similarly, DAR function was also augmented by small interfering RNA reduction of the endogenous NKA. These data suggest that, under basal conditions, NKA negatively regulates DAR function via protein-protein interactions. In reciprocal fashion, expression of DARs decreases endogenous NKA function in the absence of dopamine, implicating DAR proteins as regulators of NKA activity. Notably, dopamine stimulation or pertussis toxin inhibition of D2 receptor signaling did not alter NKA activity, indicating that the D2-mediated decrease in NKA function is dependent upon protein-protein interactions rather than signaling molecules. This evidence for reciprocal regulation between DARs and NKA provides a novel control mechanism for both DAR signaling and cellular ion balance.


Figures

FIGURE 1.
FIGURE 1.
Identification of D2 receptor-interacting proteins from HEK293T cells by co-immunoprecipitation and mass spectrometry. The SDS-polyacrylamide gel was stained with colloidal Coomassie Blue for protein detection. Bands in the FLAG-D2L lane were derived from HEK293T cells transfected with 30 μg of FLAG-tagged rat D2L receptor and immunoprecipitated with antibody against the FLAG epitope. Bands in the FLAG Tag lane were immunoprecipitated from HEK293T cells expressing only the FLAG epitope and serve as a control. Bands were excised from both experimental and control lanes and subjected to MS-based sequencing; identified proteins are reported in Table 1. Band number indicates the position of bands that were determined by MS to contain NKAα1 subunit or rat D2L receptor peptides as reported in Table 2.
FIGURE 2.
FIGURE 2.
Co-immunoprecipitation of D1 DAR with the NKAα1 subunit from transfected HEK293T cells. For all blots, proteins were extracted, immunoprecipitated (IP) with anti-FLAG agarose, electrophoresed, and immunoblotted (IB) as described under “Experimental Procedures.” A, HEK293T cells were transfected with 15 μg of FLAG tag alone, FLAG-D1 receptor, or FLAG-D1 receptor with NKAα1 subunit. Left panel, the blot was probed with a monoclonal anti-D1 antibody and visualized using ECL after incubation with an HRP-conjugated anti-rat secondary antibody. Right panel, the blot in left panel was stripped of all antibodies, re-probed with a monoclonal anti-NKAα1 antibody, and visualized by ECL after incubation with an HRP-conjugated anti-mouse secondary antibody. The arrow indicates the position of the NKAα1 subunit migrating at ∼95 kDa. B, HEK293T cells were transfected with 15 μg of FLAG tag, FLAG-D1, or FLAG-D1 receptor lacking the carboxyl terminus (FLAG-D1-T0) in the presence or absence of transiently co-expressed NKAα1 subunit (15 μg). The Western blot was probed with a monoclonal anti-NKAα1 antibody and visualized by ECL after incubation with an HRP-conjugated anti-mouse secondary antibody. The arrow indicates the position of the NKAα1 subunit migrating at ∼95 kDa.
FIGURE 3.
FIGURE 3.
Co-immunoprecipitation of D2L DAR with the NKAα1 subunit from transfected HEK293T cells. Proteins were extracted, immunoprecipitated (IP) with anti-FLAG agarose, electrophoresed, and immunoblotted (IB) as described under “Experimental Procedures.” HEK293T cells were transfected with 15 μg each of either FLAG tag alone, FLAG-D2L receptor, or FLAG-D2L receptor with NKAα1 subunit. Left panel, the blot was probed with a polyclonal anti-D2S/L antibody and visualized using ECL after incubation with an HRP-conjugated anti-rabbit secondary antibody. Right panel, the blot in left panel was stripped of all antibodies, re-probed with a monoclonal anti-NKAα1 antibody, and visualized by ECL after incubation with an HRP-conjugated anti-mouse secondary antibody. The arrow indicates the position of the NKAα1 subunit migrating at ∼95 kDa.
FIGURE 4.
FIGURE 4.
Co-immunoprecipitation of the NKAα1 subunit with the D2 DAR from bovine striatum. Proteins were extracted from bovine striatum with 1% CHAPS in Tris-HCl buffer, immunoprecipitated (IP) via the Catch and Release system (Pierce) with the anti-D2S/L antibody, electrophoresed, and immunoblotted (IB) as described under “Experimental Procedures.” Left panel, the blot was probed with a polyclonal anti-D2S/L antibody and visualized using ECL after incubation with an HRP-conjugated anti-rabbit secondary antibody. Right panel, the blot in left panel was stripped of all antibodies, re-probed with a monoclonal anti-NKAα1 antibody, and visualized by ECL after incubation with an HRP-conjugated anti-mouse secondary antibody.
FIGURE 5.
FIGURE 5.
Co-expression of the D2L-RFP with the NKAα1-eGFP. HEK293T cells were transfected with both 1 μg of D2L-RFP and 0.5 μg of NKAα1-eGFP as described under “Experimental Procedures.” After 24 h, cells were seeded on 35-mm glass-bottom culture dishes and visualized 48 h later. A, visualization of cells at a single line excitation of 543 nm, detecting NKAα1-eGFP. B, visualization of cells at a single line excitation of 488 nm, detecting D2L-RFP. C, overlay of A and B. Regions of yellow at the plasma membrane indicate protein co-localization. Images are representative of four separate experiments.
FIGURE 6.
FIGURE 6.
DAR function following NKAα1 overexpression. HEK293T cells were co-transfected with 15 μg of DAR (D2L (A) or D1 (B)) and 7.5 μg of either empty pcDNA vector or NKAα1. Cells were washed 24 h later and re-plated into 24-well plates at a density of 200,000 cells per well; assays were conducted 48 h post-transfection. Cells were stimulated with forskolin and dopamine (A) or dopamine alone (B), and cAMP accumulation was measured as described under “Experimental Procedures.” Data were normalized for individual experiments as a percentage of the Emax value for DAR alone and are expressed as mean ± S.E. of four independent experiments, each conducted in triplicate; all statistical analyses were performed using Student's t test. For D2L alone (A), raw values for Emax (maximal dopamine-induced inhibition) ranged from 4.0 to 8.2 pmol of cAMP/200,000 cells; normalized Emax (% inhibition) values were 49.2 ± 1.1% for D2L alone and 20.2 ± 0.5% for D2L + NKA (***, p < 0.001). EC50 values were 5.0 nm for D2L alone and 14.7 nm for D2L + NKA (p < 0.01). For D1 alone (B), raw values for Emax ranged from 22.0 to 49.4 pmol of cAMP/200,000 cells; normalized Emax values were 99.7 ± 0.8% for D1 alone and 81.3 ± 0.9% for D1 + NKA (***, p < 0.001). EC50 values were 13.5 nm for D1 alone and 40.0 nm for D1 + NKA (p < 0.001).
FIGURE 7.
FIGURE 7.
Total DAR density after NKAα1 overexpression. HEK293T cells were co-transfected with 15 μg of DAR (D2L (A) or D1 (B)) and 7.5 μg of either empty pcDNA vector or NKAα1. Cells were washed 24 h later and remained in the plate until the assay was conducted, 48 h post-transfection. Radioligand binding assays were performed using [3H]methylspiperone (D2L, A) or [3H]SCH23390 (D1, B) as described under “Experimental Procedures.” Data were normalized for individual experiments as a percentage of the Bmax value for DAR alone and are expressed as mean ± S.E. of four independent experiments, each conducted in triplicate; all statistical analyses were performed using Student's t test. For D2L alone (A), raw values for Bmax ranged from 7.2 to 13.1 fmol/mg protein; normalized Bmax for D2L + NKA was 20.3 ± 0.4% (***, p < 0.001). KD values were 23 ± 1 pm for D2L alone and 13 ± 2 pm for D2L + NKA. For D1 alone (B), raw values for Emax ranged from 4.1 to 11.2 fmol/mg protein; normalized Bmax for D1 + NKA was 37.2 ± 0.4% (***, p < 0.001). KD values were 126 ± 7 pm for D1 alone and 104 ± 5 pm for D1 + NKA.
FIGURE 8.
FIGURE 8.
DAR function after ouabain inhibition of NKAα1. HEK293T cells were co-transfected with 15 μg of DAR (D2L (A) or D1 (B)) and 7.5 μg of either empty pcDNA vector or NKAα1. Cells were washed 24 h later and re-plated into 24-well plates at a density of 200,000 cells per well; assays were conducted 48 h post-transfection. Five min prior to agonist treatment, cells were placed into media with (test) or without (control) ouabain. Cells were then stimulated with forskolin and dopamine (A) or dopamine alone (B) for 10 min in the presence or absence of ouabain (OUA), and cAMP accumulation was measured as described under “Experimental Procedures.” Data were normalized for individual experiments as a percentage of the Emax value for DAR alone and are expressed as mean ± S.E. of five independent experiments, each conducted in triplicate; all statistical analyses were performed using one-way ANOVA with Bonferroni's post test. For D2L alone (A), raw values for Emax (maximal dopamine-induced inhibition) ranged from 6.6 to 10.1 pmol of cAMP/200,000 cells. For D1 alone (B), raw values for Emax ranged from 37.9 to 68.4 pmol of cAMP/200,000 cells. Complete Emax and EC50 data are summarized in Table 3.
FIGURE 9.
FIGURE 9.
Cell-surface D2L DAR density following ouabain inhibition of NKAα1. HEK293T cells were co-transfected with 15 μg of D2L and 7.5 μg of either empty pcDNA vector or NKAα1. Cells were washed 24 h later and replated in 24-well plates at a density of 200,000 cells/well; assays were conducted 48 h post-transfection. Radioligand binding assays were performed by incubating cells concomitantly with [3H]sulpiride in the presence of vehicle or ouabain (OUA), as described under “Experimental Procedures.” Data were normalized for individual experiments as a percentage of the Bmax value for D2L alone and are expressed as mean ± S.E. of three independent experiments, each conducted in triplicate. All statistical analyses were performed using one-way ANOVA with Bonferroni's post-test; ***, p < 0.001 as compared with control. For D2L alone, raw values for Bmax ranged from 33.0 to 42.41 fmol/100,000 cells. Complete Bmax and KD data are reported in Table 4.
FIGURE 10.
FIGURE 10.
Co-immunoprecipitation of NKAα1 with D2L DAR following siRNA treatment. HEK293T cells transiently expressing 5 μg of FLAG-D2L receptor were co-transfected with 3 μg of empty pcDNA vector, scrambled siRNA, or anti-NKAα1 siRNA for 48 or 72 h as indicated. Proteins were extracted, immunoprecipitated (IP) with anti-FLAG agarose, electrophoresed, and immunoblotted (IB) as described under “Experimental Procedures.” The blot was probed with a monoclonal anti-NKAα1 antibody and visualized by ECL after incubation with an HRP-conjugated anti-mouse secondary antibody. The arrow indicates the position of the NKAα1 subunit migrating at ∼95 kDa.
FIGURE 11.
FIGURE 11.
DAR function following siRNA inhibition of NKAα1. HEK293T cells were co-transfected with 5 μg of DAR cDNA (D2L (A) or D1 (B)) and 3 μg of either scrambled siRNA vector or anti-NKAα1 siRNA. Cells were washed 24 h later and re-plated into 24-well plates at a density of 200,000 cells per well. Assays were conducted 48 h post-transfection, and cAMP accumulation was measured as described under “Experimental Procedures.” Data were normalized for individual experiments as a percentage of the Emax value for DAR alone and are expressed as mean ± S.E. of four independent experiments conducted in triplicate; curves represent single experiments. All statistical analyses were performed on pooled data using one-way ANOVA with Bonferroni's post-test. For D2L alone (A), raw values for Emax (maximal dopamine-induced inhibition) ranged from 5.3 to 7.5 pmol of cAMP/200,000 cells; normalized Emax (% inhibition) values were 35.4 ± 1.7% for D2L alone and 50.1 ± 2.9% for D2L + NKAα1 siRNA (*, p < 0.05). EC50 values were 2.2 nm for D2L alone and 8.1 nm for D2L+ NKAα1 siRNA. For D1 alone (B), raw values for Emax ranged from 11.3 to 32.4 pmol of cAMP/200,000 cells; normalized Emax values were 99.8 ± 2.0% for D1 alone and 209.0 ± 1.9% for D1 + NKAα1 siRNA (***, p < 0.001). EC50 values were 95.5 nm for D1 alone and 173.3 nm for D1 + NKAα1 siRNA (p < 0.05).
FIGURE 12.
FIGURE 12.
NKA function following D2L DAR transfection. HEK293T cells were transfected with 7.5 μg of either D2L cDNA or empty pcDNA vector (UTs). Cells were washed 24 h later, and for cells involving pertussis toxin treatment (PTX), 125 ng/ml PTX was added to media 16 h prior to experimentation. 48 h post-transfection, cells were removed into assay buffer and 86Rb+ uptake, in the presence or absence of dopamine (DA), was measured as described under “Experimental Procedures.” Data were normalized for individual experiments as a percentage of the Emax value for UT cells alone and are expressed as mean ± S.E. of five independent experiments, each conducted in duplicate. All statistical analyses were performed using one-way ANOVA with Bonferroni's post-test; *, p < 0.05; **, p < 0.01. UT raw Emax values ranged from 109 to 219 pmol/mg protein/min.
FIGURE 13.
FIGURE 13.
NKA function following D1 DAR transfection. HEK293T cells were transfected with 5 μg of either D1 cDNA or empty pcDNA vector (UTs). Cells were washed 24 h later. 48 h post-transfection, cells were removed into assay buffer, and 86Rb+ uptake, in the presence or absence of dopamine (DA), was measured as described under “Experimental Procedures.” Data were normalized for individual experiments as a percentage of the Emax value for UT cells alone and are expressed as mean ± S.E. of five independent experiments, each conducted in duplicate. All statistical analyses were performed using one-way ANOVA with Bonferroni's post-test; *, p < 0.05; **, p < 0.01. UT raw Emax values ranged from 106 to 174 pmol/mg protein/min.
FIGURE 14.
FIGURE 14.
Model of DAR-NKA interactions as illustrated for the D1 DAR. A, close proximity of NKA and DAR, via protein-protein interactions, causes conformational hindrance of G-protein coupling to the receptor. This in turn diminished the downstream signaling cascade following ligand stimulation. B, binding of dopamine (DA) to the D1 DAR results in conformational changes to the DAR that cause compensatory conformational changes in the NKA. These changes to the pump allow enhanced transport of Na+ and K+ across the plasma membrane. C, ouabain binding to the NKA results in conformational changes to the sodium pump, enabling enhanced coupling between DAR and G-proteins. This causes an increase in the downstream signaling cascade upon dopamine stimulation.

Similar articles

Cited by

References

    1. El-Ghundi, M., O'Dowd, B. F., and George, S. R. (2007) Rev. Neurosci. 18 37-66 - PubMed
    1. Goldman-Rakic, P. S. (1998) Adv. Pharmacol. 42 707-711 - PubMed
    1. Missale, C., Nash, S. R., Robinson, S. W., Jaber, M., and Caron, M. G. (1998) Physiol. Rev. 78 189-225 - PubMed
    1. Schultz, W. (2002) Neuron 36 241-263 - PubMed
    1. Sealfon, S. C., and Olanow, C. W. (2000) Trends Neurosci. 23 S34-S40 - PubMed

Publication types

LinkOut - more resources