. 2008 Dec 26;283(52):36542-52.
doi: 10.1074/jbc.M804578200. Epub 2008 Nov 4.

The histone demethylases JMJD1A and JMJD2B are transcriptional targets of hypoxia-inducible factor HIF

Affiliations

The histone demethylases JMJD1A and JMJD2B are transcriptional targets of hypoxia-inducible factor HIF

Sophie Beyer et al. J Biol Chem. .

Abstract

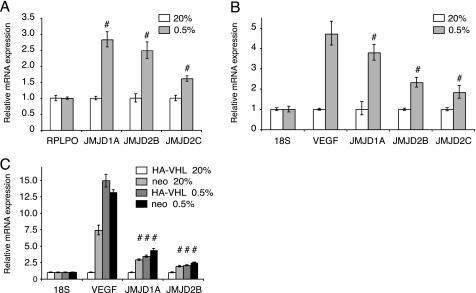
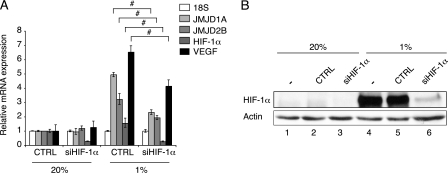
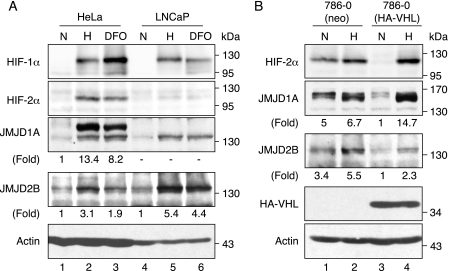
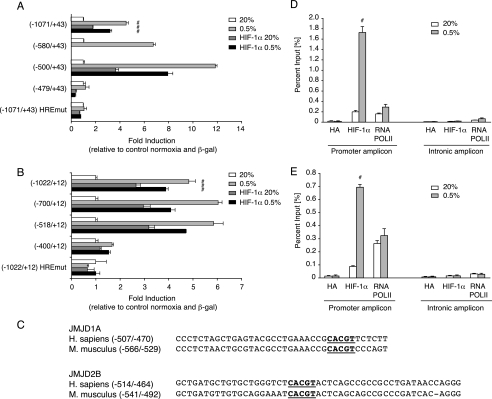
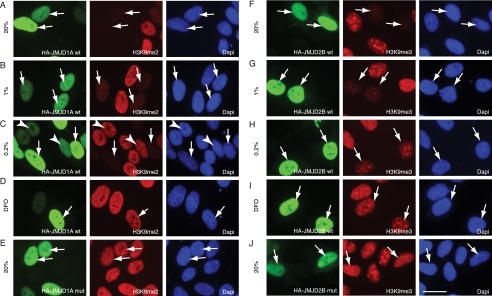
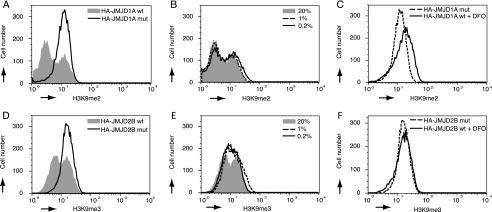
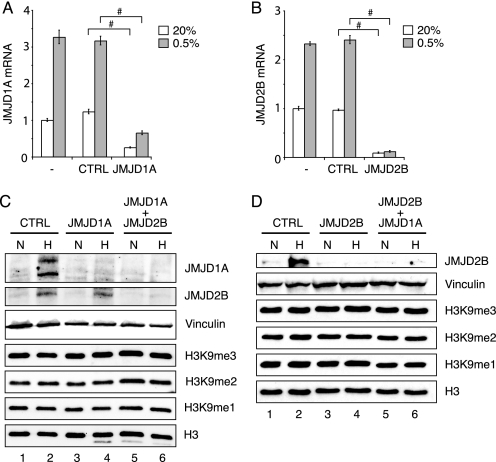
Posttranslational histone modifications serve to store epigenetic information and control both nucleosome assembly and recruitment of non-histone proteins. Histone methylation occurs on arginine and lysine residues and is involved in the regulation of gene transcription. A dynamic control of these modifications is exerted by histone methyltransferases and the recently discovered histone demethylases. Here we show that the hypoxia-inducible factor HIF-1alpha binds to specific recognition sites in the genes encoding the jumonji family histone demethylases JMJD1A and JMJD2B and induces their expression. Accordingly, hypoxic cells express elevated levels of JMJD1A and JMJD2B mRNA and protein. Furthermore, we find increased expression of JMJD1A and JMJD2B in renal cancer cells that have lost the von Hippel Lindau tumor suppressor protein VHL and therefore display a deregulated expression of hypoxia-inducible factor. Studies on ectopically expressed JMJD1A and JMJD2B indicate that both proteins retain their histone lysine demethylase activity in hypoxia and thereby might impact the hypoxic gene expression program.


Figures

FIGURE 1.
FIGURE 1.
Induction of expression of JmjC mRNAs in hypoxia or upon loss of VHL. A, quantitative real time reverse transcriptase-PCR analysis of relative transcript levels of JMJD1A, JMJD2B, and JMJD2C in LNCaP cells upon 16 h incubation in 20 or 0.5% oxygen. B, relative mRNA levels including VEGF in HeLa cells treated as in A. C, relative mRNA levels in control (neo) and VHL-reconstituted (HA-VHL) 786-0 RCC cells treated as in A. For each mRNA the values were normalized to RPLPO or 18S transcripts and levels in normoxic control samples were set to 1. Values are mean ± S.D. and error bars are representative of 3 replicates. #, p < 0.01 using a two-tailed t test.
FIGURE 2.
FIGURE 2.
Suppression of HIF-1α by siRNA compromises hypoxic induction of JMJD1A and JMJD2B. A, quantitative real time reverse transcriptase-PCR analysis of relative transcript levels of HIF-1α, VEGF, JMJD1A, and JMJD2B in HeLa cells transfected with control (CTRL) or HIF-1α siRNA prior to 16 h incubation in 20 or 1% oxygen. Values were normalized to 18S transcripts and levels in normoxic samples transfected with control siRNA were set to 1. Data represent the mean ± S.D. and error bars represent n = 3. #, p < 0.01 for the indicated comparisons. B, representative immunoblot analysis for HIF-1α andβ-actin using whole cell extracts from HeLa cells that were either treated with transfection reagent only (-), transfected with control siRNA or HIF-1α siRNA prior to parallel incubation in normoxia (20% O2) or hypoxia (1% O2, 16 h).
FIGURE 3.
FIGURE 3.
Hypoxia and loss of VHL induce the expression of JMJD1A and JMJD2B. A, immunoblot analysis for JMJD1A, JMJD2B, HIF-1α, and HIF-2α in whole cell extracts from HeLa and LNCaP cells incubated in normoxia (N, 20% O2), hypoxia (H, 0.5% O2, 16 h) or treated with 100 μm DFO in normoxia (DFO, 16 h). Numbers below panels indicate fold induction compared with untreated cells normalized to actin loading control. B, JMJD1A and JMJD2B protein expression in 786-0 RCC cells. Control (neo) and VHL reconstituted cells (HA-VHL) were incubated in normoxia (N) or 0.5% oxygen (H) for 16 h. Fold inductions relative to normoxic cells expressing HA-VHL are indicated.
FIGURE 4.
FIGURE 4.
The JMJD1A and JMJD2B promoter sequences contain functional HIF binding sites. A, luciferase reporter assay with constructs containing the indicated sequences from the human JMJD1A gene promoter region. Positions in base pairs relative to the start site of transcription are indicated. Plasmids were co-transfected into HeLa cells along with a CMV-lacZ control plasmid and a HIF-1α expression vector where indicated. 24 h after transfection, cells were incubated in normoxia (20%) or 0.5% oxygen (0.5%) for 16 h. Indicated are fold induction values normalized to β-galactosidase activity and relative to normoxic control samples. Data are shown as the mean ± S.D. of 3 replicates. #, p < 0.01 relative to control samples. B, same experimental setup as in A but with reporter gene vectors containing the indicated JMJD2B promoter regions. C, comparison of the identified hypoxia response elements (highlighted) and flanking nucleotides in the human and mouse JMJD1A and JMJD2B gene promoter sequences. D, ChIP assay to determine binding of endogenous HIF-1α and RNA polymerase II to the JMJD1A promoter. HeLa cells were kept in normoxia (20% O2) or incubated in 0.5% O2 for 8 h. The precipitated DNA was amplified by real time quantitative PCR using specific primers for regions within the promoter (left) and the third intron of JMJD1A (right). Enrichments are presented as percentages of total input. Data are shown as the mean ± S.D. of 3 replicates. #, p < 0.01 relative to normoxic samples. E, ChIP analysis as in D on the JMJD2B locus. Amplicons are located within the promoter and within the second intron of JMJD2B, respectively.
FIGURE 5.
FIGURE 5.
Ectopic expression of JMJD1A and JMJD2B leads to loss of H3K9me2 and H3K9me3 in normoxia and hypoxia. HeLa cells were transfected with HA-tagged JMJD1A (A-D) or HA-tagged JMJD2B (F-I) and incubated in normoxia (20% O2; A and F), 1% O2 (B and G), 0.2% O2 (C and H), or in the presence of 100 μm DFO (D and I) for 24 h. E, cells transfected with JMJD1A mutant. J, cells transfected with JMJD2B mutant. The cells were fixed, costained for the indicated histone modifications and for the expression of jumonji proteins (anti-HA), and analyzed by indirect immunofluorescence microscopy. White arrows indicate cells expressing the tested protein. Arrowheads in C indicate cells with lower expression levels of HA-JMJD1A. The cells were counterstained with 4′,6-diamidino-2-phenylindole to visualize cell nuclei. Scale bar in J corresponds to 20 μm.
FIGURE 6.
FIGURE 6.
Flow cytometry analysis of the effect of different ambient oxygen levels on the activity of JMJD1A and JMJD2B. HeLa cells were transfected with HA-tagged JMJD1A, mutant JMJD1A, JMJD2B, or mutant JMJD2B and incubated in normoxia (20% O2), 1% O2, 0.2% O2, or in the presence of 100 μm DFO in normoxia for 24 h. The cells were fixed, costained for H3K9me2 (A-C) or H3K9me3 (D-F) and for the expression of jumonji proteins (anti-HA) and analyzed by flow cytometry. Depicted are results for transfected (HA positive) cells only. A, effect of overexpression of JMJD1A compared with mutant JMJD1A on cellular H3K9me2 levels. B, impact of oxygen tension on JMJD1A demethylase activity. C, comparison of mutant JMJD1A and DFO treatment. D, H3K9me3 levels in JMJD2B and mutant JMJD2B overexpressing cells. E, impact of oxygen availability on JMJD2B demethylase activity. F, effect of DFO compared with mutant JMJD2B on H3K9me3.
FIGURE 7.
FIGURE 7.
siRNA-mediated down-regulation of JMJD1A and JMJD2B does not change global histone H3K9 methylation levels. A, transcript levels of JMJD1A in HeLa cells after treatment with Oligofectamine alone (-), control siRNA (CTRL), or JMJD1A-directed siRNA. 24 h after transfection, cells were incubated in normoxia (N, 20% O2) or hypoxia (H, 0.5% O2) for 16 h. Values were normalized to 18S transcripts and levels in untransfected normoxic samples were set to 1. Error bars represent mean ± S.D. of 3 replicates; # p < 0.01. B, transcript levels of JMJD2B after treatment with JMJD2B-directed siRNA. C, immunoblot analysis for JMJD1A, JMJD2B, vinculin (loading control), histone H3K9me3, H3K9me2, H3K9me1, and total histone H3 in extracts from HeLa cells after treatment with control siRNA, JMJD1A-directed siRNA, or a mixture of JMJD2B- and JMJD1A-directed oligonucleotides. Hypoxia treatment was performed as in A. D, immunoblot analysis for JMJD2B, vinculin, histone H3K9me3, H3K9me2, H3K9me1, and total histone H3 in extracts from cells treated with JMJD2B-directed siRNA or a combination of JMJD2B- and JMJD1A-siRNA in normoxia and hypoxia.

Similar articles

Cited by

References

    1. Bannister, A. J., Zegerman, P., Partridge, J. F., Miska, E. A., Thomas, J. O., Allshire, R. C., and Kouzarides, T. (2001) Nature 410 120-124 - PubMed
    1. Kim, J., Daniel, J., Espejo, A., Lake, A., Krishna, M., Xia, L., Zhang, Y., and Bedford, M. T. (2006) EMBO Rep. 7 397-403 - PMC - PubMed
    1. Lachner, M., O'Carroll, D., Rea, S., Mechtler, K., and Jenuwein, T. (2001) Nature 410 116-120 - PubMed
    1. Taverna, S. D., Ilin, S., Rogers, R. S., Tanny, J. C., Lavender, H., Li, H., Baker, L., Boyle, J., Blair, L. P., Chait, B. T., Patel, D. J., Aitchison, J. D., Tackett, A. J., and Allis, C. D. (2006) Mol. Cell 24 785-796 - PMC - PubMed
    1. Wysocka, J., Swigut, T., Xiao, H., Milne, T. A., Kwon, S. Y., Landry, J., Kauer, M., Tackett, A. J., Chait, B. T., Badenhorst, P., Wu, C., and Allis, C. D. (2006) Nature 442 86-90 - PubMed