

KIF5B gene sequence variation and response of cardiac stroke volume to regular exercise
- PMID: 18984674
- PMCID: PMC2636926
- DOI: 10.1152/physiolgenomics.00003.2008
KIF5B gene sequence variation and response of cardiac stroke volume to regular exercise
Abstract
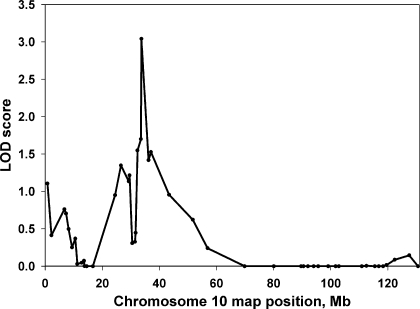
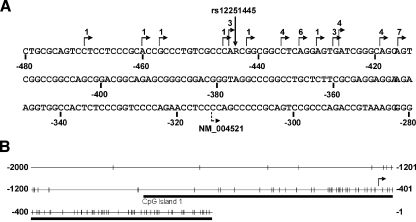
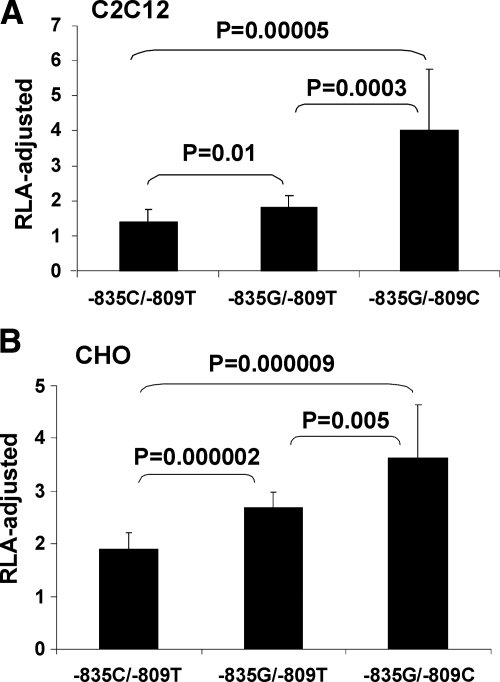
A genome-wide linkage scan for endurance training-induced changes in stroke volume detected a quantitative trait locus on chromosome 10p11 in white families of the HERITAGE Family Study. Dense microsatellite mapping narrowed down the linkage region to a 7 Mb area containing 16 known and 14 predicted genes. Association analyses with 90 single nucleotide polymorphisms (SNPs) provided suggestive evidence (P values from 0.03 to 0.06) for association in the kinesin heavy chain (KIF5B) gene locus in the whole cohort. The associations at the KIF5B locus were stronger (P values from 0.001 to 0.008) when the analyses were performed on linkage-informative families only (family-specific logarithm of the odds ratio scores >0.025 at peak linkage location). Resequencing the coding and regulatory regions of KIF5B revealed no new exonic SNPs. However, the putative promoter region was particularly polymorphic, containing eight SNPs with at least 5% minor allele frequency within 1850 bp upstream of the start codon. Functional analyses using promoter haplotype reporter constructs led to the identification of sequence variants that had significant effects on KIF5B promoter activity. Analogous inhibition and overexpression experiments showed that changes in KIF5B expression alter mitochondrial localization and biogenesis in a manner that could affect the ability of the heart to adjust to regular exercise. Our data suggest that KIF5B is a strong candidate gene for the response of stroke volume to regular exercise. Furthermore, training-induced changes in submaximal exercise stroke volume may be due to mitochondrial function and variation in KIF5B expression as determined by functional SNPs in its promoter.
Figures


Similar articles
-
Titin is a candidate gene for stroke volume response to endurance training: the HERITAGE Family Study.Physiol Genomics. 2003 Sep 29;15(1):27-33. doi: 10.1152/physiolgenomics.00147.2002. Physiol Genomics. 2003. PMID: 12865504
-
Cis-regulatory variations: a study of SNPs around genes showing cis-linkage in segregating mouse populations.BMC Genomics. 2006 Sep 15;7:235. doi: 10.1186/1471-2164-7-235. BMC Genomics. 2006. PMID: 16978413 Free PMC article.
-
CREB1 is a strong genetic predictor of the variation in exercise heart rate response to regular exercise: the HERITAGE Family Study.Circ Cardiovasc Genet. 2010 Jun;3(3):294-9. doi: 10.1161/CIRCGENETICS.109.925644. Epub 2010 Apr 20. Circ Cardiovasc Genet. 2010. PMID: 20407090 Free PMC article.
-
The human gene map for performance and health-related fitness phenotypes: the 2001 update.Med Sci Sports Exerc. 2002 Aug;34(8):1219-33. doi: 10.1097/00005768-200208000-00001. Med Sci Sports Exerc. 2002. PMID: 12165675 Review.
-
Genetics of the adaptation to exercise.World Rev Nutr Diet. 2011;102:144-149. doi: 10.1159/000327801. Epub 2011 Aug 5. World Rev Nutr Diet. 2011. PMID: 21865828 Review. No abstract available.
Cited by
-
Remodeling of mechanical junctions and of microtubule-associated proteins accompany cardiac connexin43 lateralization.Heart Rhythm. 2012 Jul;9(7):1133-1140.e6. doi: 10.1016/j.hrthm.2012.03.003. Epub 2012 Mar 7. Heart Rhythm. 2012. PMID: 22406144 Free PMC article.
-
Advances in exercise, fitness, and performance genomics in 2010.Med Sci Sports Exerc. 2011 May;43(5):743-52. doi: 10.1249/MSS.0b013e3182155d21. Med Sci Sports Exerc. 2011. PMID: 21499051 Free PMC article. Review.
-
Personalized preventive medicine: genetics and the response to regular exercise in preventive interventions.Prog Cardiovasc Dis. 2015 Jan-Feb;57(4):337-46. doi: 10.1016/j.pcad.2014.08.005. Epub 2014 Aug 13. Prog Cardiovasc Dis. 2015. PMID: 25559061 Free PMC article. Review.
-
Genomics and genetics in the biology of adaptation to exercise.Compr Physiol. 2011 Jul;1(3):1603-48. doi: 10.1002/cphy.c100059. Compr Physiol. 2011. PMID: 23733655 Free PMC article. Review.
-
Physical Activity Associated Proteomics of Skeletal Muscle: Being Physically Active in Daily Life May Protect Skeletal Muscle From Aging.Front Physiol. 2019 Mar 26;10:312. doi: 10.3389/fphys.2019.00312. eCollection 2019. Front Physiol. 2019. PMID: 30971946 Free PMC article.
References
-
- Abecasis GR, Cherny SS, Cookson WO, Cardon LR. Merlin–rapid analysis of dense genetic maps using sparse gene flow trees. Nat Genet 30: 97–101, 2002. - PubMed
-
- Abecasis GR, Cookson WO. GOLD–graphical overview of linkage disequilibrium. Bioinformatics 16: 182–183, 2000. - PubMed
-
- An P, Rice T, Gagnon J, Leon AS, Skinner JS, Bouchard C, Rao DC, Wilmore JH. Familial aggregation of stroke volume and cardiac output during submaximal exercise: The HERITAGE Family Study. Int J Sports Med 21: 566–572, 2000. - PubMed
Publication types
MeSH terms
Substances
Grants and funding
LinkOut - more resources
Full Text Sources
Molecular Biology Databases
Miscellaneous