. 2008 Nov;20(11):3122-35.
doi: 10.1105/tpc.108.058974. Epub 2008 Nov 4.

The Arabidopsis GRAS protein SCL14 interacts with class II TGA transcription factors and is essential for the activation of stress-inducible promoters

Affiliations

The Arabidopsis GRAS protein SCL14 interacts with class II TGA transcription factors and is essential for the activation of stress-inducible promoters

Benjamin Fode et al. Plant Cell. 2008 Nov.

Abstract

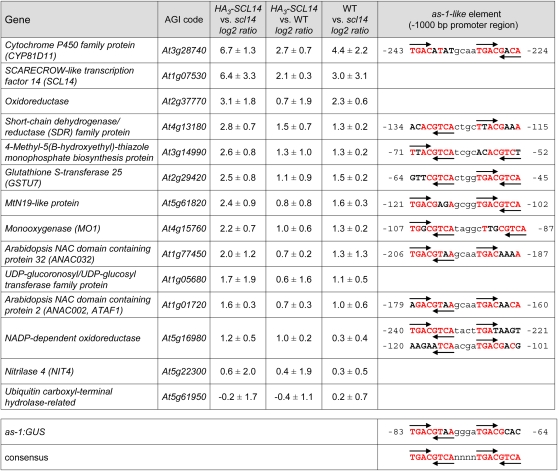
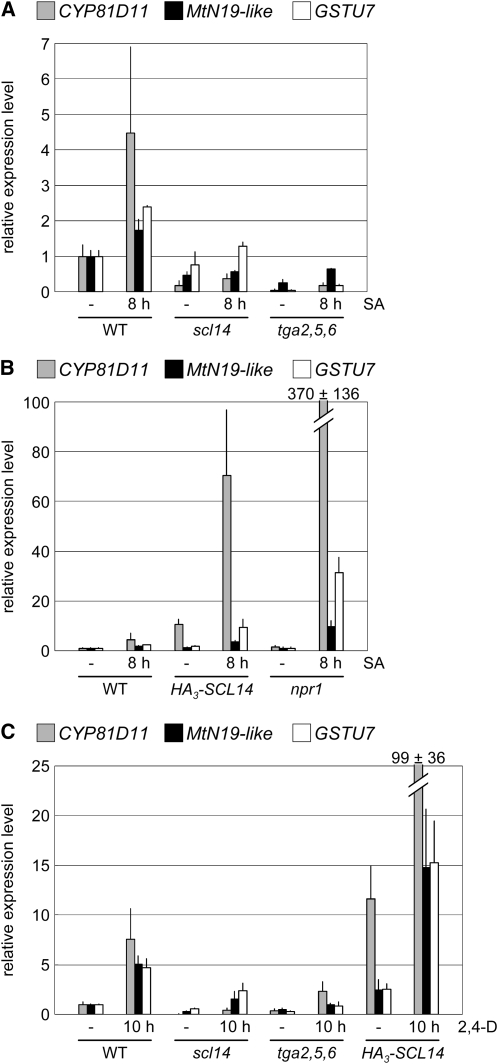
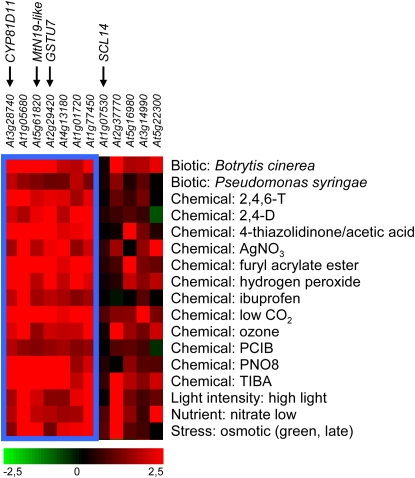
The plant signaling molecule salicylic acid (SA) and/or xenobiotic chemicals like the auxin mimic 2,4-D induce transcriptional activation of defense- and stress-related genes that contain activation sequence-1 (as-1)-like cis-elements in their promoters. as-1-like sequences are recognized by basic/leucine zipper transcription factors of the TGA family. Expression of genes related to the SA-dependent defense program systemic acquired resistance requires the TGA-interacting protein NPR1. However, a number of as-1-containing promoters can be activated independently from NPR1. Here, we report the identification of Arabidopsis thaliana SCARECROW-like 14 (SCL14), a member of the GRAS family of regulatory proteins, as a TGA-interacting protein that is required for the activation of TGA-dependent but NPR1-independent SA- and 2,4-D-inducible promoters. Chromatin immunoprecipitation experiments revealed that class II TGA factors TGA2, TGA5, and/or TGA6 are needed to recruit SCL14 to promoters of selected SCL14 target genes identified by whole-genome transcript profiling experiments. The coding regions and the expression profiles of the SCL14-dependent genes imply that they might be involved in the detoxification of xenobiotics and possibly endogenous harmful metabolites. Consistently, plants ectopically expressing SCL14 showed increased tolerance to toxic doses of the chemicals isonicotinic acid and 2,4,6-triiodobenzoic acid, whereas the scl14 and the tga2 tga5 tga6 mutants were more susceptible. Hence, the TGA/SCL14 complex seems to be involved in the activation of a general broad-spectrum detoxification network upon challenge of plants with xenobiotics.


Figures

Figure 1.
Figure 1.
Quantitative Analysis of the TGA2-SCL14 Interaction in Yeast. (A) Yeast protein–protein–DNA interaction system. The host strain carries three copies of the as-1 element upstream of the lacZ reporter gene. SCL14 and TGA2 coding regions were expressed under the control of the MET25- and the ADH1 promoter, respectively, either alone or in combination as indicated. Interaction is measured as induction of β-galactosidase activity. (B) Yeast two-hybrid system. β-Galactosidase activities of the yeast strain PJ69-4A, which contains the lacZ reporter gene under the control of the GAL7 promoter. Prey plasmids encode TGA2 fused to the GBD; bait plasmids encode SCL14 or NPR1 fused to the GAD. (C) Yeast protein–protein–DNA interaction system using the same host strain as in (A). TGA2 was expressed under the control of the MET25 promoter. Fusion proteins with the GAD served as prey. (D) Yeast two-hybrid system as in (B). Bait plasmids encode either full-length SCL14 (amino acids 1 to 769) or the SCL14 lacking the C-terminal GRAS domain (amino acids 1 to 381) fused to the GAD. β-Galactosidase activities are indicated as Miller units. The mean value (±sd) from four independent yeast transformants is shown. The hyphens indicate the respective empty vectors.
Figure 2.
Figure 2.
Pull-Down Assay to Demonstrate the in Vitro Interaction between TGA2 and SCL14. GST, GST-SCL14, or His6-TGA2 were expressed in E. coli under the control of an isopropyl-1-thio-β-d-galactopyranoside (IPTG)–inducible promoter and mixed with extracts from noninduced (non-ind.) cells to obtain input samples containing approximately equal amounts of recombinant proteins as documented by Coomassie blue staining of an SDS gel (lanes 1 to 4). Protein gel blot analysis to test for the presence of His6-TGA2 was performed with the Universal HIS detection reagent (lanes 5 to 8 and 11 and 12). Extracts containing either GST or GST-SCL14 were incubated with extracts containing His6-TGA2 and loaded onto glutathione-sepharose beads. The protein composition of the eluates was analyzed by Coomassie blue staining (lanes 9 and 10) and protein gel blot analysis (lanes 11 and 12) after separation of the proteins by SDS gel electrophoresis.
Figure 3.
Figure 3.
Localization of the SCL14-GFP Fusion Protein in Protoplasts of Tobacco BY-2 Cells. Protoplasts were transfected with plasmids encoding GFP or SCL14-GFP, incubated in the presence (2 μM LMB) or absence (mock) of the nuclear export inhibitor Leptomycin B and analyzed by fluorescence microscopy. Bright-field (right) and fluorescence images (left) are shown. Bars = 25 μm. [See online article for color version of this figure.]
Figure 4.
Figure 4.
Expression Analysis of as-1:GUS Plants with Different SCL14 Protein Levels. (A) Protein gel blot analysis of as-1:GUS (WT) plants, HA3-SCL14 transgenic plant line #5 (HA3-SCL14), and scl14 mutant plants using the αSCL14 antiserum. The star marks an unspecific protein band that serves as a loading control. (B) Position of the T-DNA insertion within the gene At1g07530 in line SALK_126931. White boxes indicate untranslated regions, and the thick black line marks the intron within the 5′ untranslated region. Right and left borders of the T-DNA are abbreviated as RB and LB, respectively. (C) and (D) RNA gel blot analysis of GUS transcript levels in as-1:GUS plants (WT) and as-1:GUS plants expressing HA3-SCL14 (transgenic line #5) treated with either SA (C) or 2,4-D (D). (E) RNA gel blot analysis of SCL14, GSTF8, and PR-1 transcript levels in SA-treated as-1:GUS (WT) and scl14 plants. (F) RNA gel blot analysis of SCL14 and GSTF8 transcript levels in 2,4-D–treated as-1:GUS (WT) and scl14 plants. Three-week-old plants were treated with 1 mM SA or 0.1 mM 2,4-D for the time spans indicated above the lanes ([C] to [F]). Ethidium bromide–stained rRNA is shown as evidence of equal loading. All plants lines, including the scl14 mutant, carry the as-1:GUS transgene; WT refers to an intact SCL14 allele. The hyphens indicate untreated plants.
Figure 5.
Figure 5.
Quantitative Real-Time RT-PCR Analysis of Candidate Genes Identified by Microarray Analysis of Plants Containing Different SCL14 Protein Levels. RNA from as-1:GUS plants (WT), as-1:GUS plants transformed with a CaMV 35S:HA3-SCL14 construct (HA3-SCL14), and scl14 mutant plants was subjected to quantitative real-time RT-PCR analysis. Plants were grown for 3 weeks on MS plates. Values denote ratios of transcription levels between the two indicated genotypes. The mean values (±sd) of three independent experiments are shown. Genes were arranged according to the expression ratios between HA3-SCL14 and scl14 plants. See Supplemental Table 1 online for expression data obtained from microarray analysis. Sequences of as-1-like elements found in the respective promoter regions are shown in the rightmost column. The numbers indicate their positions relative to the transcriptional start sites (+1). Conserved nucleotides within the two 8-bp palindromes (capital letters) are highlighted in red. Half sites of the palindromes that contain at least three of the four conserved TGAC nucleotides are marked by arrows. The sequence and the position of the as-1 element within the CaMV 35S promoter are shown.
Figure 6.
Figure 6.
In Vivo SCL14 and TGA Factor Binding to the Promoters of CYP81D11, MtN19-like, and GSTU7 as Revealed by Chromatin Immunoprecipitation Analysis. (A) Leaves from as-1:GUS (WT) plants and scl14 and tga2 tga5 tga6 (tga2,5,6) mutants were incubated in 1% formaldehyde before chromatin preparation. Chromatin samples were subjected to immunoprecipitation using 5 μL of cleared αTGA2,5 antiserum (top panel) or crude αSCL14 antiserum (bottom panel). The DNA was recovered after reversal of the cross-links and analyzed for the enrichment of promoter sequences by quantitative real-time PCR. Quantitation of relative amounts of PCR product with respect to wild-type chromatin (WT; set to 100%) with ACTIN8 sequences as a reference is shown. Values indicate means (±sd) of three independent chromatin immunoprecipitation experiments done with three independent chromatin preparations from three batches of independently grown plants. The data set obtained for the wild type and scl14 chromatin treated with the αSCL14 antiserum was derived from five independent chromatin preparations and five independent immunoprecipitation experiments. Unpaired Student's t tests were performed on the data to show significant differences compared with the reference gene GES (At1g61120), respectively (* P < 0.1, ** P < 0.05, and *** P < 0.01). (B) Protein gel blot analysis of crude whole cell or chromatin probed either with αTGA2,5 antiserum (left panel) or crude αSCL14 antiserum (right panel), respectively. The genotype of the analyzed plants is indicated below the lanes. The star marks a nonspecific band.
Figure 7.
Figure 7.
Expression Analysis of Endogenous SCL14 Target Genes after SA and 2,4-D Treatment. Quantitative real-time RT-PCR analysis of relative CYP81D11 MtN19-like and GSTU7 transcript levels in as-1:GUS (WT) plants, HA3-SCL14 transgenic plant line #5, and scl14, tga2 tga5 tga6 (tga2,5,6), and npr1-1 mutant plants. Three-week-old plants were treated with 1 mM SA ([A] and [B]) or 0.1 mM 2,4-D (C) for the indicated time spans (hyphens indicate untreated plants). Transcript values in untreated as-1:GUS plants were set to 1. The mean values (±sd) of three independent induction experiments are shown. Except for the tga2 tga5 tga6 and npr1-1 mutants, analyzed plant lines carry the as-1-GUS transgene; WT refers to an intact SCL14 allele.
Figure 8.
Figure 8.
Genevestigator V3 Clustering Analysis of Genes Listed in Figure 5. Genes (columns) were clustered based upon their expression in response to different treatments (rows) using the Biclustering method (BiMax algorithm). The color scale represents log2 ratio of fold change. The blue box marks the cluster of genes, all of which are upregulated under the indicated subset of conditions. No probe sets are available for At4g15760 and At5g61950 on the 22k Affymetrix array. 2,4,6-T, 2,4,6-trihydroxybenzamide; PCIB, p-chlorophenoxyisobutyric acid; PNO8, N-octyl-3-nitro-2,4,6-trihydroxybenzamide.
Figure 9.
Figure 9.
Complementation of the scl14 Mutant Phenotype. Quantitative real-time RT-PCR analysis (top panel) of relative CYP81D11 transcript levels in as-1:GUS (WT) and scl14 plants and three independent transgenic lines expressing SCL14 under the control of the CaMV 35S promoter in the scl14 mutant background (scl14/35S:SCL14). Three-week-old plants grown on MS plates were treated with 0.1 mM TIBA and further incubated for 3 or 10 h as indicated below the bars (hyphens indicate untreated plants). Mean values (±sd) of three independent biological replicates are indicated. The transcript value in untreated as-1:GUS plants was set to 1. Crude protein extracts of the plants used for quantitative real-time RT-PCR analysis were subjected to protein gel blot analysis with the αSCL14 antiserum (bottom panel). The star marks an unspecific band that serves as a loading control. All plants carry the as-1:GUS transgene; WT refers to an intact SCL14 allele.
Figure 10.
Figure 10.
Susceptibility of Plants with Decreased or Increased SCL14 Protein Levels to Toxic Chemicals. (A) Growth phenotypes of as-1:GUS (WT) plants, HA3-SCL14 transgenic plant line #5, and scl14 and tga2 tga5 tga6 (tga2,5,6) mutant plants on MS plates containing 0.1 mM INA or 0.1 mM TIBA. Photographs were taken 2 weeks after germination. Bars = 5 mm. (B) Quantitative real-time RT-PCR analysis of relative CYP81D11, MtN19-like, and GSTU7 transcript levels in as-1:GUS (WT) plants and HA3-SCL14 transgenic plant line #5. Plants were grown for 3 weeks on MS plates containing 25 μM INA or 12,5 μM TIBA. Transcript values in INA- or TIBA-treated wild-type plants were set to 1. Mean values (±sd) of three independent biological replicates are indicated. Except for the tga2 tga5 tga6 mutants, analyzed plant lines carry the as-1-GUS transgene; WT refers to an intact SCL14 allele.

References

    1. Apel, K., and Hirt, H. (2004). Reactive oxygen species: Metabolism, oxidative stress, and signal transduction. Annu. Rev. Plant Biol. 55 373–399. - PubMed
    1. Baerson, S.R., Sanchez-Moreiras, A., Pedrol-Bonjoch, N., Schulz, M., Kagan, I.A., Agarwal, A.K., Reigosa, M.J., and Duke, S.O. (2005). Detoxification and transcriptome response in Arabidopsis seedlings exposed to the allelochemical benzoxazolin-2(3H)-one. J. Biol. Chem. 280 21867–21881. - PubMed
    1. Bensmihen, S., To, A., Lambert, G., Kroj, T., Giraudat, J., and Parcy, F. (2004). Analysis of an activated ABI5 allele using a new selection method for transgenic Arabidopsis seeds. FEBS Lett. 561 127–131. - PubMed
    1. Blanco, F., Garreton, V., Frey, N., Dominguez, C., Perez-Acle, T., Van der Straeten, D., Jordana, X., and Holuigue, L. (2005). Identification of NPR1-dependent and independent genes early induced by salicylic acid treatment in Arabidopsis. Plant Mol. Biol. 59 927–944. - PubMed
    1. Bolle, C. (2004). The role of GRAS proteins in plant signal transduction and development. Planta 218 683–692. - PubMed

Publication types

MeSH terms