. 2008:4:230.
doi: 10.1038/msb.2008.66. Epub 2008 Nov 4.

Hepatitis C virus infection protein network

Affiliations

Hepatitis C virus infection protein network

B de Chassey et al. Mol Syst Biol. 2008.

Abstract

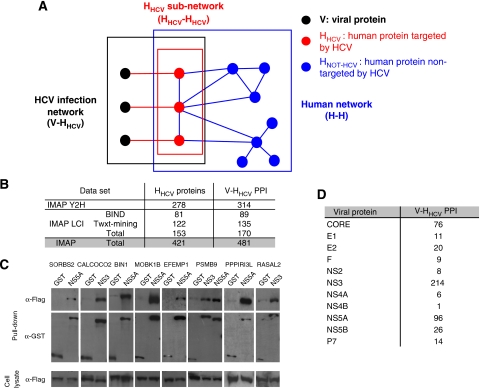
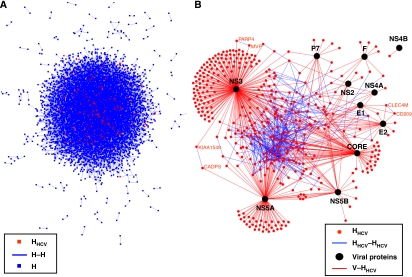
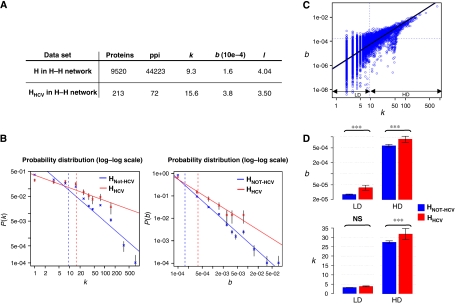
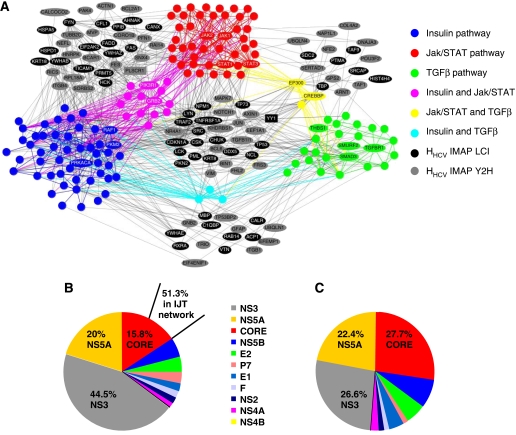
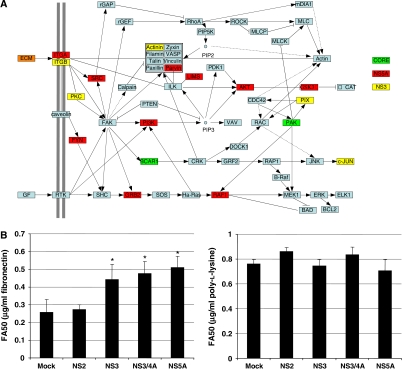
A proteome-wide mapping of interactions between hepatitis C virus (HCV) and human proteins was performed to provide a comprehensive view of the cellular infection. A total of 314 protein-protein interactions between HCV and human proteins was identified by yeast two-hybrid and 170 by literature mining. Integration of this data set into a reconstructed human interactome showed that cellular proteins interacting with HCV are enriched in highly central and interconnected proteins. A global analysis on the basis of functional annotation highlighted the enrichment of cellular pathways targeted by HCV. A network of proteins associated with frequent clinical disorders of chronically infected patients was constructed by connecting the insulin, Jak/STAT and TGFbeta pathways with cellular proteins targeted by HCV. CORE protein appeared as a major perturbator of this network. Focal adhesion was identified as a new function affected by HCV, mainly by NS3 and NS5A proteins.


Conflict of interest statement

The authors declare that they have no conflict of interest.

Figures

Figure 1
Figure 1
The HCV interaction network. (A) Nomenclature. V: viral protein (black node). HHCV: human protein interacting with HCV proteins (red node). HNot-HCV: human protein not interacting with HCV proteins (blue node). V-HHCV: HCV–human protein interaction (red edge). HHCV–HHCV: interaction between HCV-interacting human proteins (blue edge). H–H: human–human protein interaction (blue edges). V-HHCV represents the interactions between HCV and human proteins (black box). HHCV–HHCV is composed of human proteins interacting with viral proteins (red box). H–H network represents interactions between human proteins (blue box). (B) Number of proteins and interactions in HCV–human interaction network. Number of human proteins interacting with HCV proteins (HHCV) and corresponding number of protein–protein interactions (V-HHCV PPI). Data are given for our yeast two-hybrid screens (IMAP Y2H) and for literature-curated interactions (IMAP LCI). (C) Validation of Y2H interactions by co-affinity purification assay. Nine out of 22 positive co-AP assays are shown, representing the following: NS5A-SORBS2, NS3-CALCOCO2, NS5A-BIN1, NS5A-MOBK1B, NS5A-EFEMP1, NS3-PSMB9 and NS5A-PSMB9, NS5A-PPPIRI3L, NS3-RASAL2. After pull-down with GST-tagged viral baits or with negative-control GST alone cellular preys are identified with anti-Flag antibody. Anti-GST antibody identifies either GST-alone or GST-tagged viral baits. Expression of cellular preys in cell lysate is controlled by anti-Flag (bottom panel). (D) Number of interactions by viral protein.
Figure 2
Figure 2
Graphical representation of the HCV–human interaction network. (A) Graphical representation of H–H network. Each node represents a protein and each edge represents an interaction. Red and blue nodes are HHCV and HNot-HCV, respectively. (B) Graphical representation of V–HHCV interaction network. Black node: viral protein; red node: human protein; red edge: interaction between human and viral proteins (V–HHCV); blue edge: interaction between human proteins (HHCV–HHCV). The largest component containing 196 proteins is represented in the middle of the network. Names of cellular proteins belonging to the three other connected components are also represented.
Figure 3
Figure 3
Topological analysis of the HCV–human interaction network. (A) Topological analysis of H and HHCV in H–H network. Average values of degree (k), betweenness (b) and shortest path length (l) for all human proteins and for HHCV from the IMAP Y2H data set. (B) Degree and betweenness distribution of H and HHCV proteins in H–H network. P(k) is the probability of a node to connect k other nodes in the network. P(b) is the probability of a node to have a betweeness equal to b in the network. Normalized log degree (left) and log betweenness (right) distribution of H (blue) and HHCV proteins (red). Solid line represents linear regression fit. Vertical dashed lines give mean degree and betweenness values. Each class is represented with conventional standard error. (C) Degree and betweenness correlation of H in H–H network. Normalized log degree (x axis) and log betweenness (y axis) of H proteins into H–H network. Black solid line represents the linear regression fit (R2=0.56). Horizontal and vertical dashed lines give the mean degree and betweenness values, respectively. Low-degree (LD) and high-degree (HD) classes were defined by using the average degree cutoff. (D) Mean degree and betweenness of HNot-HCV and HHCV for LD and HD proteins. Top: mean betweenness (log scale) of HNot-HCV (blue) and HHCV (red) is given for LD and HD classes. Bottom: mean degree of HNot-HCV (blue) and HHCV (red) is given for LD and HD classes. The conventional standard error threshold and the U-test P-value are represented (***P-value <10−10, NS: not significant).
Figure 4
Figure 4
IJT network. (A) Graphical representation of IJT network. Protein (nodes) members of insulin (blue), Jak/STAT (red) and TGFβ (green) pathways according to KEGG annotation, and their interactions (edges) are shown (proteins interacting with HCV proteins are named). Proteins shared by two pathways are shown in secondary colours (pink, yellow and cyan). Grey and black nodes are neighbours that connect the KEGG pathways and that interact with HCV proteins (grey: protein from the IMAP Y2H data set; black: protein from the IMAP LCI data set). Neighbours interacting with HCV but not connecting the KEGG pathways are not represented. Discussed protein examples PLSCR1 and YY1 are in box. References to visualization tools are provided in supplementary files (network visualization). IJT network construction in Supplementary methods. (B) Relative contribution of each viral protein in V–HHCV. Percentage interactions for the three most interacting viral proteins, relative to the total number of interactions as listed in Supplementary Table SI, are shown. A total of 51.3% of CORE interactions are concentrated in the IJT network. (C) Relative contribution of each viral protein in IJT network. Percentage interactions for the three most interacting viral proteins, relative to the total number of viral protein interactions with proteins of IJT network, are shown.
Figure 5
Figure 5
Interaction of HCV with focal adhesion. (A) Schematic representation of focal adhesion adapted from KEGG (ID: Hs04510). Proteins targeted by CORE, NS5A and NS3 HCV proteins are shown in yellow, red and green, respectively. ECM is a generic term for proteins of the extracellular matrix, some of which are targeted by HCV proteins (orange). (B) Functional validation of focal adhesion perturbation by NS3 and NS5A. Ninety-six-well plates were coated with fibronectin (left) or poly-L-lysine (right) at various concentrations. The 293T cells expressing NS2, NS3, NS3/4A or NS5A were plated on the matrix for 30 min. Adherent cells were stained with crystal violet. FA50 is the matrix concentration for half maximum adhesion. Values represent means of triplicate with standard deviation. *Student's t-test P-value <0.05.

References

    1. Albers M, Kranz H, Kober I, Kaiser C, Klink M, Suckow J, Kern R, Koegl M (2005) Automated yeast two-hybrid screening for nuclear receptor-interacting proteins. Mol Cell Proteomics 4: 205–213 - PubMed
    1. Aoki-Kinoshita KF, Kanehisa M (2007) Gene annotation and pathway mapping in KEGG. Methods Mol Biol 396: 71–92 - PubMed
    1. Appel N, Schaller T, Penin F, Bartenschlager R (2006) From structure to function: new insights into hepatitis C virus RNA replication. J Biol Chem 281: 9833–9836 - PubMed
    1. Arbouzova NI, Bach EA, Zeidler MP (2006) Ken & barbie selectively regulates the expression of a subset of Jak/STAT pathway target genes. Curr Biol 16: 80–88 - PubMed
    1. Bader GD, Betel D, Hogue CW (2003) BIND: the Biomolecular Interaction Network Database. Nucleic Acids Res 31: 248–250 - PMC - PubMed

Publication types