. 2006 Dec;1(3):194-202.
doi: 10.1093/scan/nsl030.

Looking you in the mouth: abnormal gaze in autism resulting from impaired top-down modulation of visual attention

Affiliations

Looking you in the mouth: abnormal gaze in autism resulting from impaired top-down modulation of visual attention

Dirk Neumann et al. Soc Cogn Affect Neurosci. 2006 Dec.

Abstract

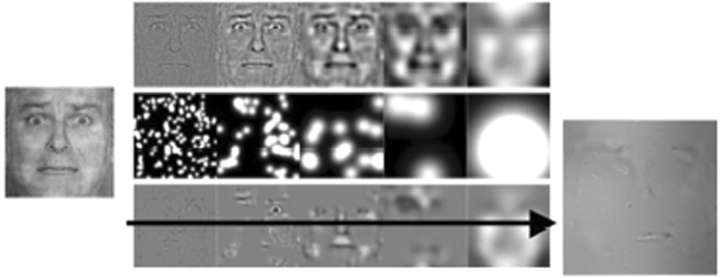
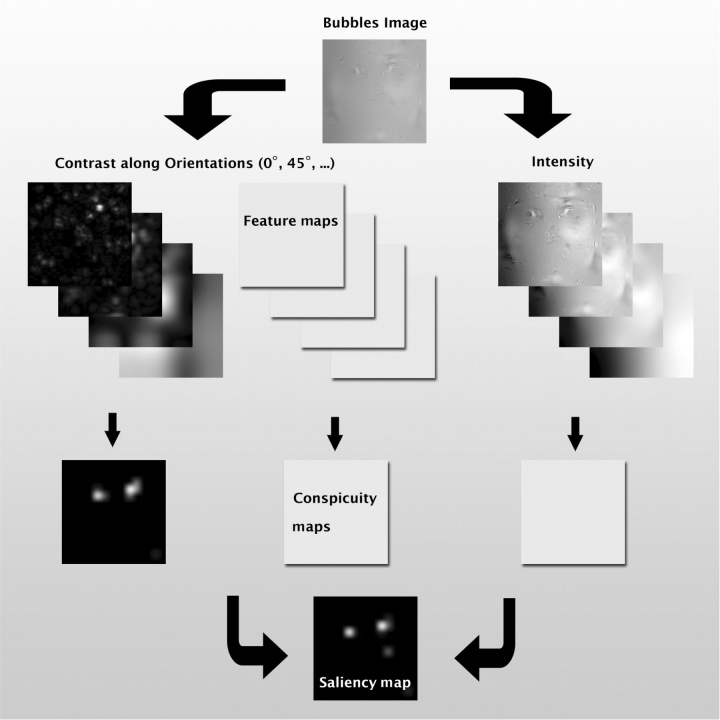
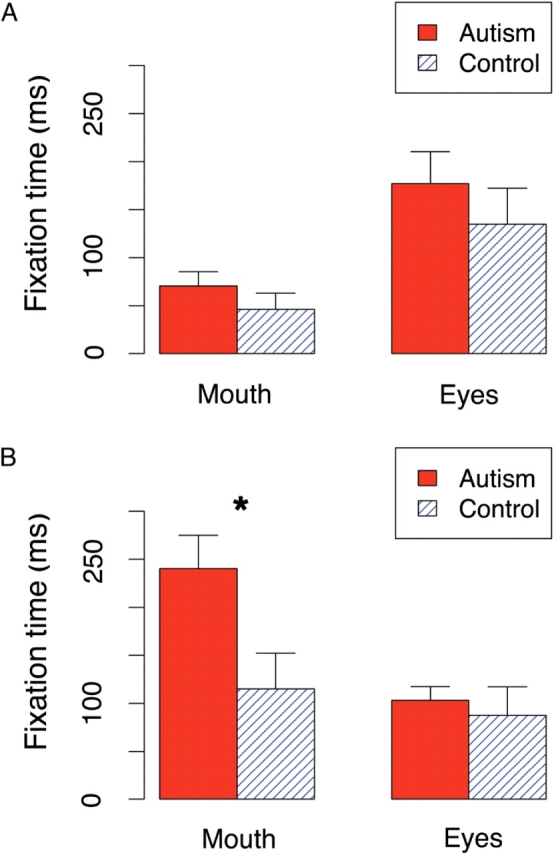
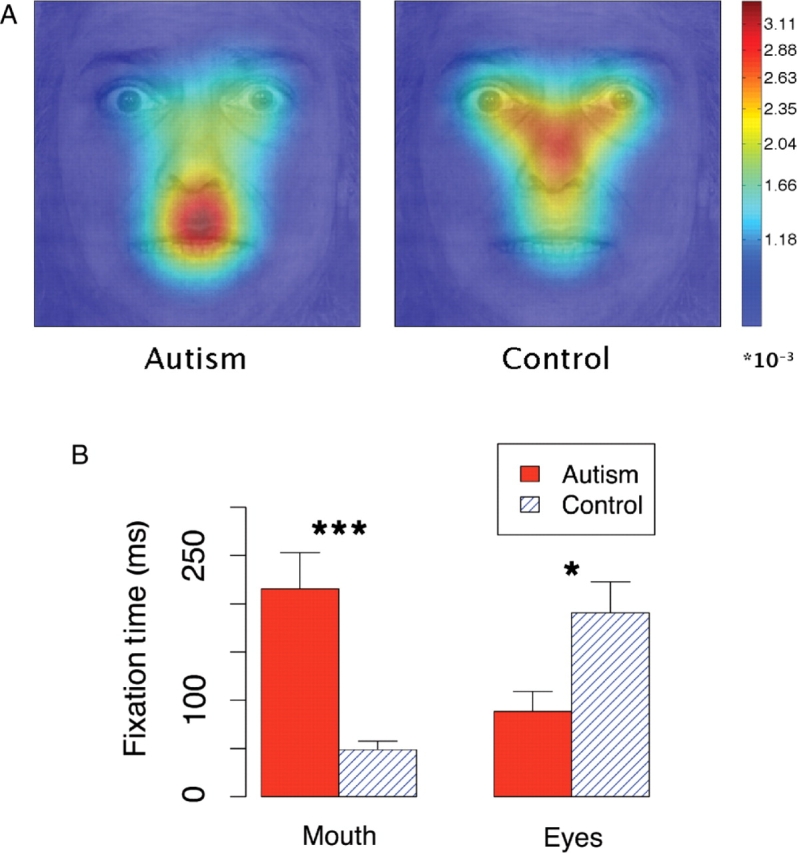
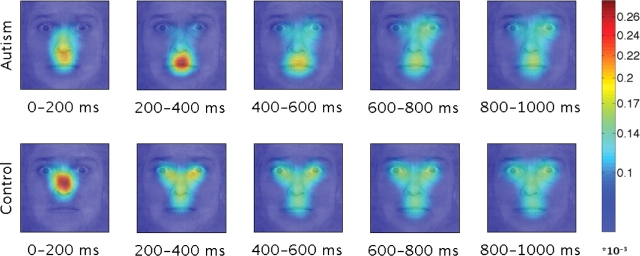
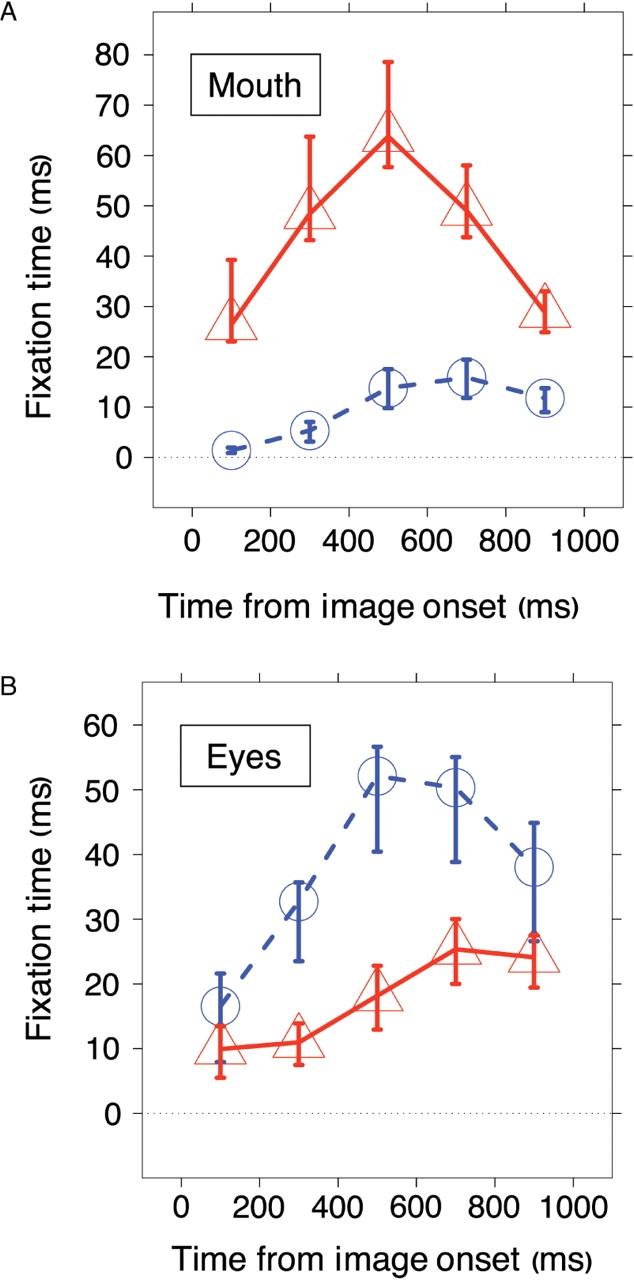
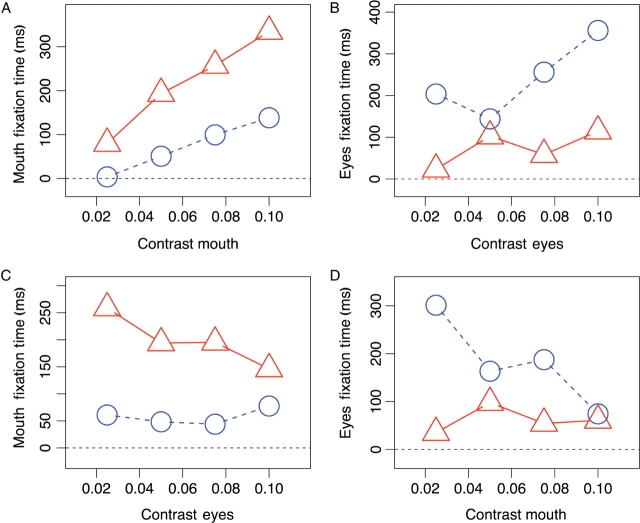
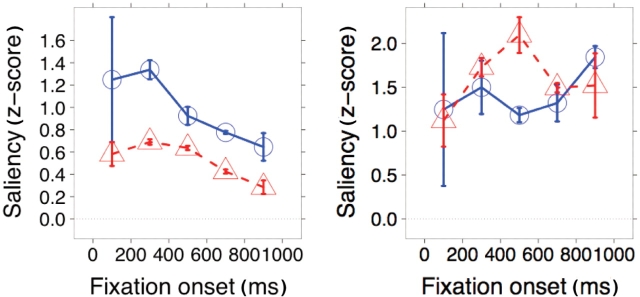
People with autism are impaired in their social behavior, including their eye contact with others, but the processes that underlie this impairment remain elusive. We combined high-resolution eye tracking with computational modeling in a group of 10 high-functioning individuals with autism to address this issue. The group fixated the location of the mouth in facial expressions more than did matched controls, even when the mouth was not shown, even in faces that were inverted and most noticeably at latencies of 200-400 ms. Comparisons with a computational model of visual saliency argue that the abnormal bias for fixating the mouth in autism is not driven by an exaggerated sensitivity to the bottom-up saliency of the features, but rather by an abnormal top-down strategy for allocating visual attention.


Figures

Fig. 1
Fig. 1
Construction of the ‘bubbles’ stimuli. An emotional facial expression (image at far left) with equal energy across all spatial frequencies (hence the somewhat grainy quality) was decomposed into five levels of spatial frequency (top row) that were randomly sampled (rows below) to generate a sparsely revealed face stimulus (image at far right).
Fig. 2
Fig. 2
Illustration of the saliency model. Images are filtered along multiple feature dimensions (luminance, and contrast in various directions). Center–surround differences at multiple spatial scales suppress responses from homogenous regions. The resulting conspicuity maps are then linearly combined into a common map that assigns every pixel of the image a saliency value.
Fig. 3
Fig. 3
Time spent looking at mouth and eyes for the first second of stimulus presentation: (A) when the whole faces are shown upright, and (B) upside-down. Error bars indicate the bootstrap standard error. *P < 0.05.
Fig. 4
Fig. 4
Fixations made during the first second of a bubbled face presentation. (A) Fixation density maps were calculated for fixations with an onset between 0 and 1000 ms for each individual using two-dimensional kernel-based smoothing (Venables and Ripley, 2002) and were subsequently averaged. (B) Average time spent viewing the mouth and the eyes. Error bars indicated bootstrap standard error. *P < 0.05, ***P < 0.001.
Fig. 5
Fig. 5
Fixation patterns for the bubbled faces. Density maps were calculated for fixations with onsets in five subsequent 200 ms time bins using kernel-based smoothing. The plot shows the average of the 10 individual maps for each group. *P < 0.05.
Fig. 6
Fig. 6
Fixation times for (A) the mouth and (B) the eyes. Viewing times of the autism group is shown in red, and of the control group in blue. Error bars indicate the bootstrap standard error.
Fig. 7
Fig. 7
Influence of contrast on the time spent viewing the facial feature. (A) Influence of mouth contrast on mouth fixations. (B) Influence of the eye contrast on the time the subject looked at the eyes. C+D) Interaction between eyes and mouth, showing the influence of the eye contrast on mouth fixations (C) and of the contrast in the mouth region on the time spent looking the eyes (D). Contrast was defined as the standard deviation of pixel intensities in a particular region normalized by the mean intensity. The data of the autism group is plotted in red, and of the control group in blue.
Fig. 8
Fig. 8
Saliency values for fixations made to the mouth (left) or eyes region of faces (right). The agreement with the saliency model is lower for people with autism (red) than for controls (blue) in the case of the mouth, but similar or even a little higher in the case of the eyes. Error bars indicate the bootstrap standard error.

References

    1. Adolphs R, Gosselin F, Buchanan TW, Tranel D, Schyns P, Damasio AR. A mechanism for impaired fear recognition after amygdala damage. Nature. 2005;433:68–72. - PubMed
    1. Adolphs R, Sears L, Piven J. Abnormal processing of social information from faces in autism. Journal of Cognitive Neuroscience. 2001;13:232–40. - PubMed
    1. Baron-Cohen S. Cambridge, MA: MIT Press; 1995. Mindblindness: An essay on autism and theory of mind.
    1. Baron-Cohen S, Campbell R, Karmiloff-Smith A, Grant J, Walker J. Are children with autism blind to the mentalistic significance of the eyes. British Journal of Developmental Psychology. 1995;13:379–98.
    1. Baron-Cohen S, Wheelwright S, Jolliffe T. Is there a “language of the eyes”? Evidence from normal adults, and adults with autism or Asperger syndrome. Visual Cognition. 1997;4:311–331.

Publication types