Meta-Analysis
. 2007 Jun;2(2):150-8.
doi: 10.1093/scan/nsm015.

Meta-analysis of functional neuroimaging data: current and future directions

Affiliations
Meta-Analysis

Meta-analysis of functional neuroimaging data: current and future directions

Tor D Wager et al. Soc Cogn Affect Neurosci. 2007 Jun.

Abstract

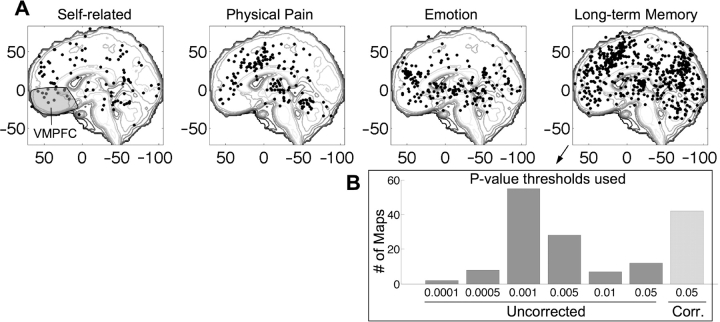
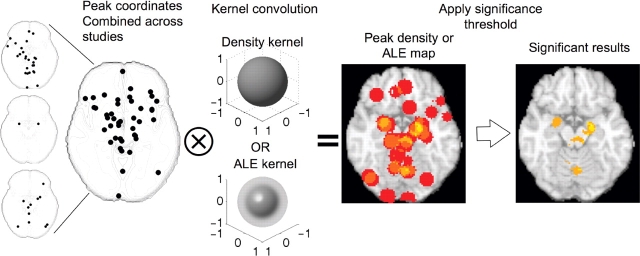
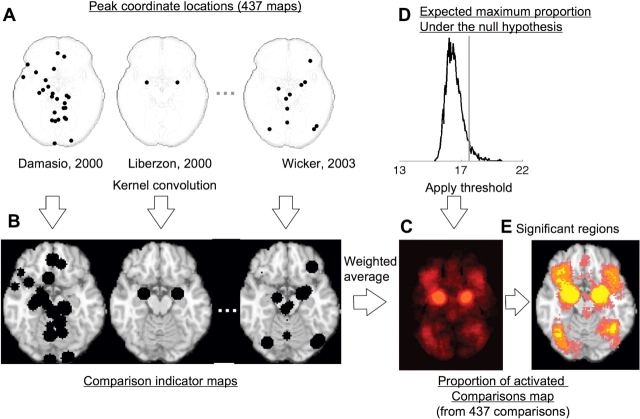
Meta-analysis is an increasingly popular and valuable tool for summarizing results across many neuroimaging studies. It can be used to establish consensus on the locations of functional regions, test hypotheses developed from patient and animal studies and develop new hypotheses on structure-function correspondence. It is particularly valuable in neuroimaging because most studies do not adequately correct for multiple comparisons; based on statistical thresholds used, we estimate that roughly 10-20% of reported activations in published studies are false positives. In this article, we briefly summarize some of the most popular meta-analytic approaches and their limitations, and we outline a revised multilevel approach with increased validity for establishing consistency across studies. We also discuss multivariate methods by which meta-analysis can be used to develop and test hypotheses about co-activity of brain regions. Finally, we argue that meta-analyses can make a uniquely valuable contribution to predicting psychological states from patterns of brain activity, and we briefly discuss some methods for making such predictions.


Figures

Fig. 1
Fig. 1
(A) Medial activation peak coordinates within 10 mm of midline from four task domains. Coordinates from the same study comparison map within 12 mm were averaged using a recursive algorithm. Imaging studies from 1993–2003 on self-related processes (n = 14 studies), physical pain (n = 24), emotion (n = 64) and long-term memory (n = 195), all report peak activations in the vmPFC, shaded in gray in the left panel. Information from all types of studies is needed to determine how strongly vmPFC activity implies self-related processing. (B) The most common thresholds in published long-term memory literature. x-axis: P-value threshold; y-axis: number of comparison maps (whole-brain analyses of an effect of interest). Based on these thresholds and rough estimates of the number of independent comparisons per map, we estimate 663 false positives in the data set, or 17% of reported activations.
Fig. 2
Fig. 2
Example of meta-analysis using KDA or ALE analysis on three studies. The three small maps on the left show peaks reported in each study for a representative axial brain slice. Peaks are combined across studies and the combined map is smoothed with a spherical kernel (KDA) or a Gaussian kernel (ALE). The resulting peak density map (middle) or ALE map is thresholded, resulting in a map of significant results (right). In this illustration, regions with three or more peaks within 10 mm were considered ‘significant.’ In practice, the analyses use Monte Carlo resampling to determine an appropriate threshold, though the interpretation of significant results differs across KDA and ALE analyses (see text). Because peaks are combined across studies and study is thus treated as a fixed effect, some individual studies may exert undue influence on the results.
Fig. 3
Fig. 3
Example procedures for multilevel kernel density analysis (MKDA) of neuroimaging studies of emotion. (A) shows the peak coordinates of three of the 437 comparison maps included in this meta-analysis. Peak coordinates of each map are separately convolved with the kernel, generating comparison indicator maps (CIMs), as seen in (B). The weighted average of the CIMs (C) is thresholded based on the distribution of the maximum proportion of activated comparison maps expected under the null hypothesis (D) to produce significant results (E). Yellow voxels are FWER corrected at P < 0.05. Other colored regions are FWER corrected for spatial extent at P < 0.05 with primary alpha levels of 0.001 (orange), 0.01(pink) and 0.05 (purple).

References

    1. Clark HH. The language-as-fixed-effect fallacy: a critique of language statistics in psychological research. Journal of Verbal Learning and Verbal Behavior. 1973;12(4):335–59.
    1. Damasio AR, Grabowski TJ, Bechara A, et al. Subcortical and cortical brain activity during the feeling of self-generated emotions. Nature Neuroscience. 2000;3(10):1049–56. - PubMed
    1. Davidson LL, Heinrichs RW. Quantification of frontal and temporal lobe brain-imaging findings in schizophrenia: a meta-analysis. Psychiatry Research. 2003;122(2):69–87. - PubMed
    1. Forman SD, Cohen JD, Fitzgerald M, Eddy WF, Mintun MA, Noll DC. Improved assessment of significant activation in functional magnetic resonance imaging (fMRI): use of a cluster-size threshold. Magnetic Resonance in Medicine. 1995;33(5):636–47. - PubMed
    1. Friston KJ, Worsley KJ, Frackowiak R.SJ, Mazziotta JC, Evans AC. Assessing the significance of focal activations using their spatial extent. Human Brain Mapping. 1994;1:210–20. - PubMed

Publication types