. 2007;111(7):2872-2878.
doi: 10.1021/jp0654718.

pH-sensitive Photoluminescence of CdSe/ZnSe/ZnS Quantum Dots in Human Ovarian Cancer Cells

Affiliations

pH-sensitive Photoluminescence of CdSe/ZnSe/ZnS Quantum Dots in Human Ovarian Cancer Cells

Yu-San Liu et al. J Phys Chem C Nanomater Interfaces. 2007.

Abstract

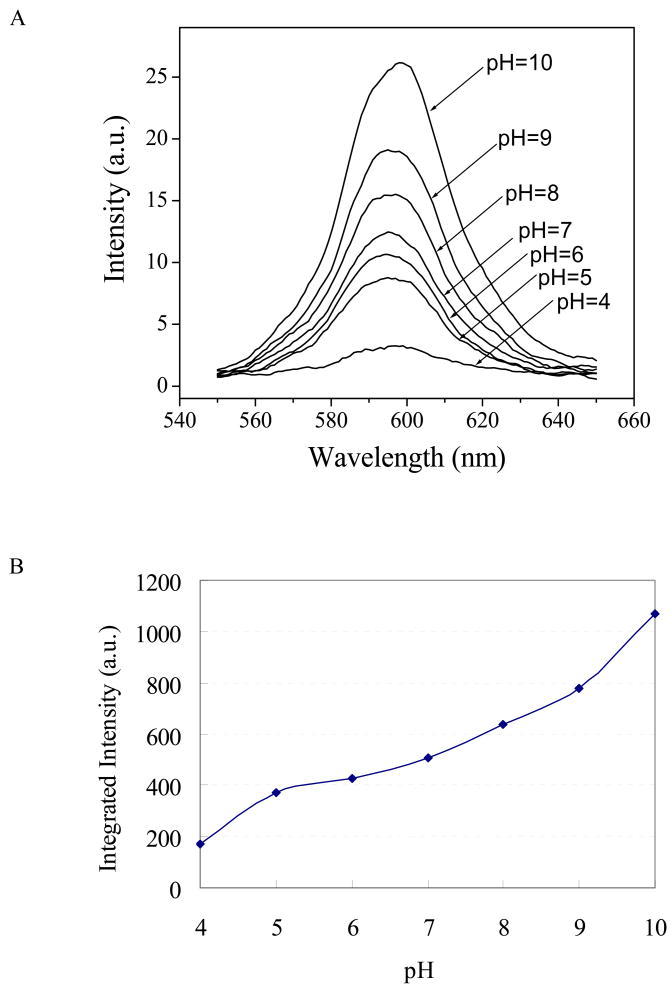
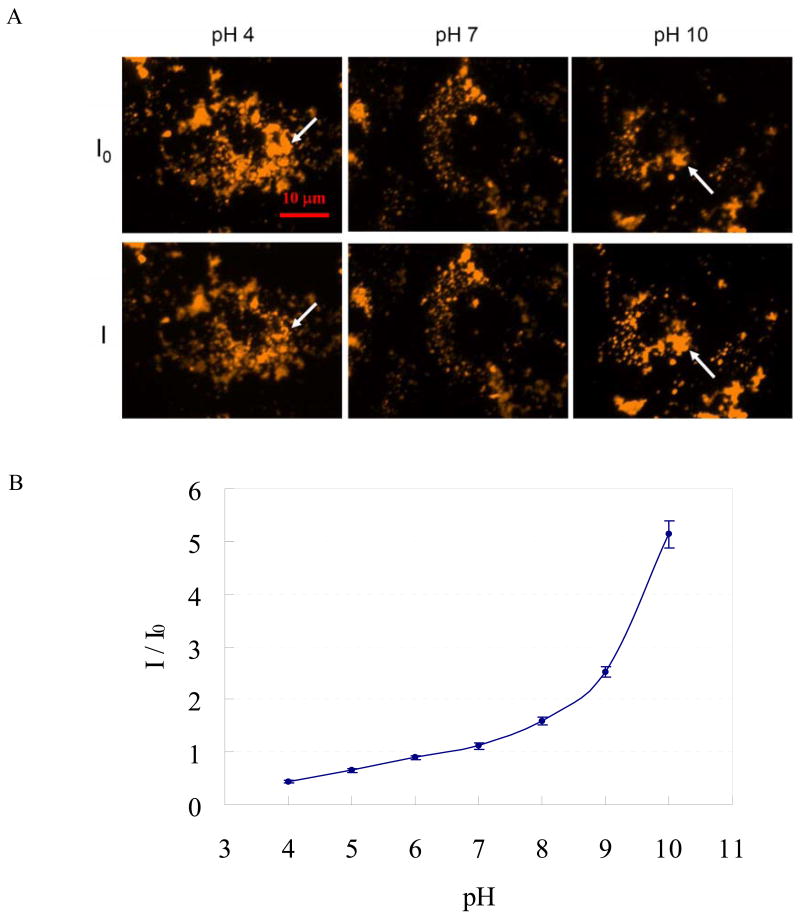
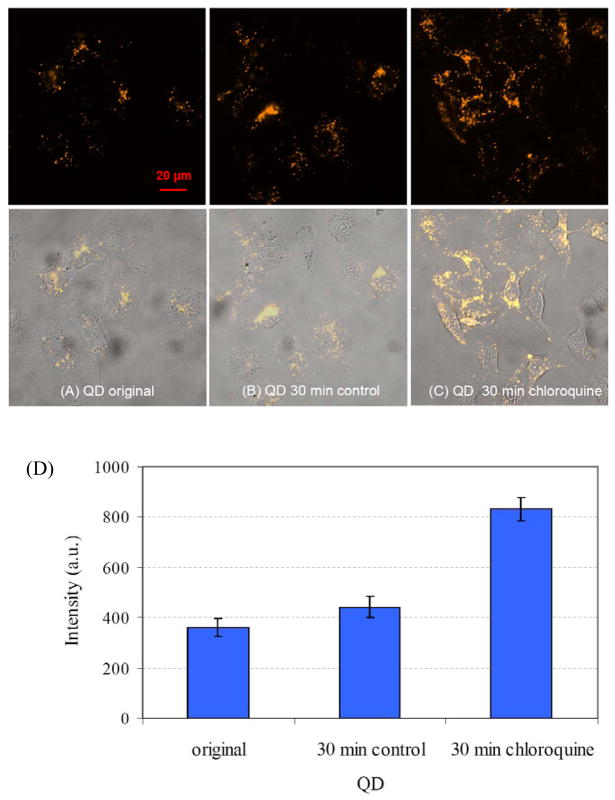
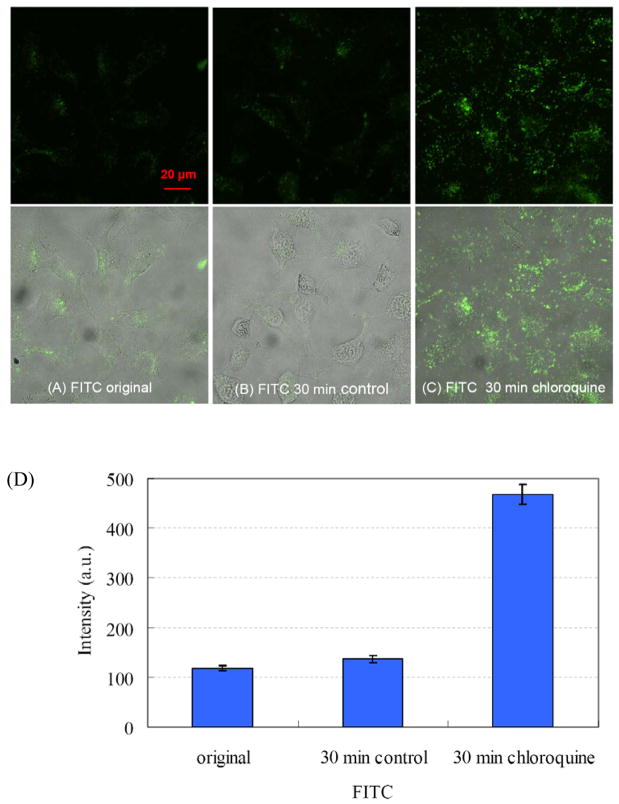
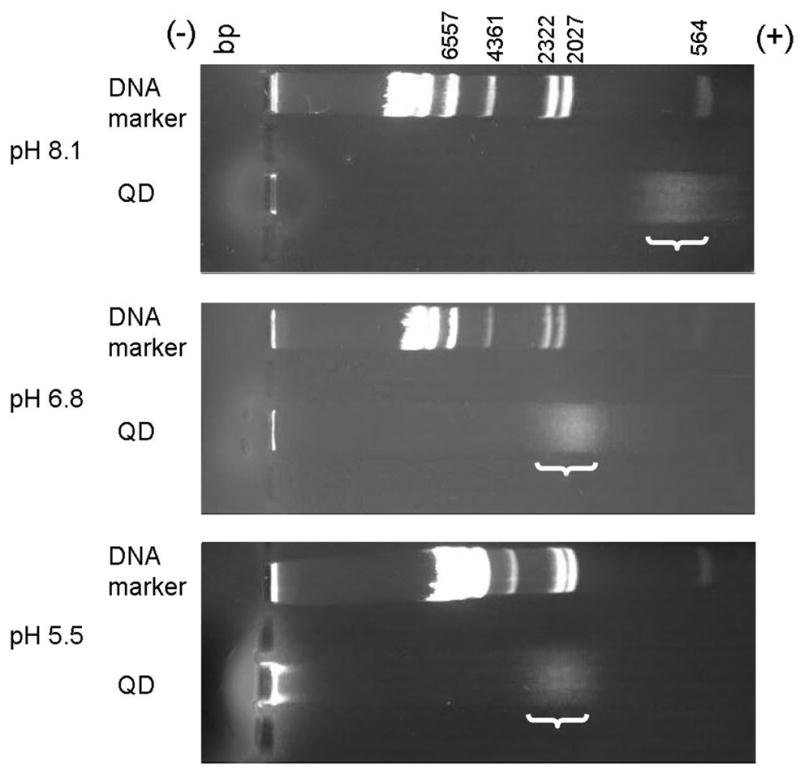
The photoluminescence of mercaptoacetic acid (MAA)-capped CdSe/ZnSe/ZnS semiconductor nanocrystal quantum dots (QDs) in SKOV-3 human ovarian cancer cells is pH-dependent, suggesting applications in which QDs serve as intracellular pH sensors. In both fixed and living cells the fluorescence intensity of intracellular MAA-capped QDs (MAA QDs) increases monotonically with increasing pH. The electrophoretic mobility of MAA QDs also increases with pH, indicating an association between surface charging and fluorescence emission. MAA dissociates from the ZnS outer shell at low pH, resulting in aggregation and loss of solubility, and this may also contribute to the MAA QD fluorescence changes observed in the intracellular environment.


Figures

Figure 1
Figure 1
Effect of pH on the photoluminescence of MAA-capped CdSe/ZnSe/ZnS quantum dots in aqueous solution. (A) The fluorescence spectra of QDs in aqueous solutions at different pH values. (B) The integrated fluorescence emission increases monotonically with pH. The spectra are measured in aqueous solutions and the excitation wavelength used is 400 nm.
Figure 2
Figure 2
Effect of pH on the photoluminescence of MAA-capped CdSe/ZnSe/ZnS quantum dots in fixed SKOV-3 ovarian cancer cells. (A) Representative fluorescence images of QD in fixed SKOV-3 ovarian cancer cells. The three images in the top row are taken before adding the pH buffer. The bottom row shows the images taken 30 s after adding buffer. I0 and I are the photometrically integrated fluorescence intensity of QD before and after adding the phosphate buffer for pH modification, respectively. All fluorescence images were taken with the same exposure time. White arrows highlight the regions where fluorescence appears to change. (B) Relative fluorescence intensity (I/I0) taken from the images in (A). About 100 regions of interests, each of area around 4 μm2, were selected for the calculation of I/I0. Error bar: ±1 standard deviation of mean.
Figure 3
Figure 3
Representative photomicrographic images of MAA-capped CdSe/ZnSe/ZnS quantum dots in living SKOV-3 ovarian cancer cells. QD fluorescence intensity increases by around two-fold after a chloroquine-induced increase in intracellular pH. (A) MAA-capped QDs in SKOV-3 ovarian cancer cells after 24 h of incubation and washing with PBS. (B) The control cells were imaged 30 min later without chloroquine treatment. (C) Increased QD fluorescence 30 minutes after adding 200 μM chloroquine. The top row are fluorescence images, and the bottom row are overlay fluorescence and bright-filed images. All fluorescence images were captured with the same exposure time. (D) Integrated intensity for (A) to (C). About 100 regions of interests, each of area around 4 μm2, were selected from about 60 cells for the integration. Error bar: ±1 standard deviation of mean.
Figure 4
Figure 4
Representative photomicrographic images of FITC-dextran in living SKOV-3 ovarian cancer cells. FITC-dextran fluorescence intensity increases by around three to four-fold after a chloroquine-induced increase in intracellular pH. (A) A traditional pH indicator, FITC-dextran was incubated with SKOV-3 ovarian cancer cells for 24 h. Cells were washed with PBS before imaging. (B) The control cells were imaged 30 min later without chloroquine treatment. (C) Increased FITC fluorescence 30 minutes after adding 200 μM chloroquine. The top row are fluorescence images, and the bottom row are overlay fluorescence and bright-filed images. All fluorescence images were captured with the same exposure time. (D) Integrated intensity for (A) to (C). About 100 regions of interests, each of area around 4 μm2, were selected from about 60 cells for the integration. Error bar: ±1 standard deviation of mean.
Figure 5
Figure 5
Gel electrophoresis of MAA-capped QDs and lambda DNA/Hind III markers at alkaline, neutral, and acid pH. DNA markers are references for comparing results in different gels. Negatively charged QDs migrate further from the cathode in higher pH. In alkaline conditions (10 mM TAE buffer, pH 8.1), the migration velocity of QDs is similar to that of DNA with ~600 bp (40 min). At neutral pH (10 mM MES buffer, pH 6.8), QDs migrate at approximately the rate of the ~2000 bp marker DNA (50 min). In acidic conditions (10 mM MES buffer, pH 5.5), QDs migrate with ~2400 bp DNA (50 min). The brackets indicate the position of the diffuse QD bands. The contrasts of the images are enhanced for better visibility.

Similar articles

Cited by

References

    1. Liu JW, Lu Y. J Am Chem Soc. 2003;125:6642–6643. - PubMed
    1. Diéguez A, Romano-Rodriguez A, Morante JR, Kappler J, Bârsan N, Göpel W. Sensors and Actuators B. 1999;60:125–137.
    1. Liang JG, Ai XP, He ZK, Pang DW. Analyst. 2004;129:619–622. - PubMed
    1. Mekis I, Talapin DV, Kornowski A, Haase M, Weller H. J Phys Chem B. 2003;107:7454–7462.
    1. Dabbousi BO, Rodriguez-Viejo J, Mikulec FV, Heine JR, Mattoussi H, Ober R, Jensen KF, Bawendi MG. J Phys Chem B. 1997;101:9463–9475.

LinkOut - more resources