

Genomewide association study for susceptibility genes contributing to familial Parkinson disease
- PMID: 18985386
- PMCID: PMC2627511
- DOI: 10.1007/s00439-008-0582-9
Genomewide association study for susceptibility genes contributing to familial Parkinson disease
Abstract
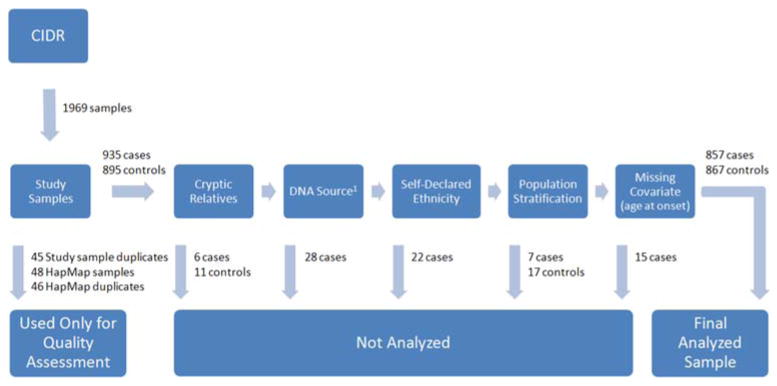
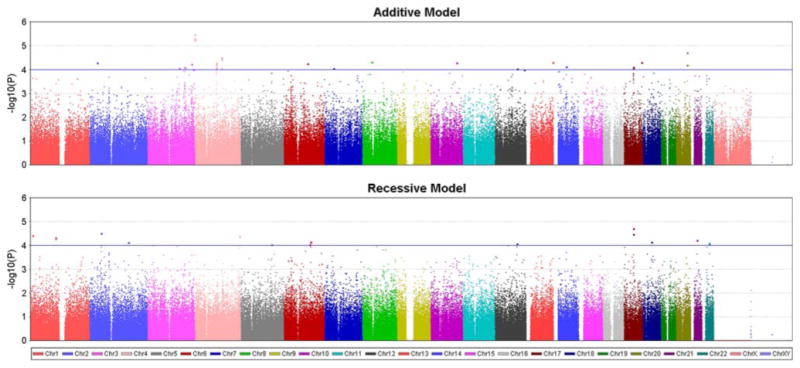
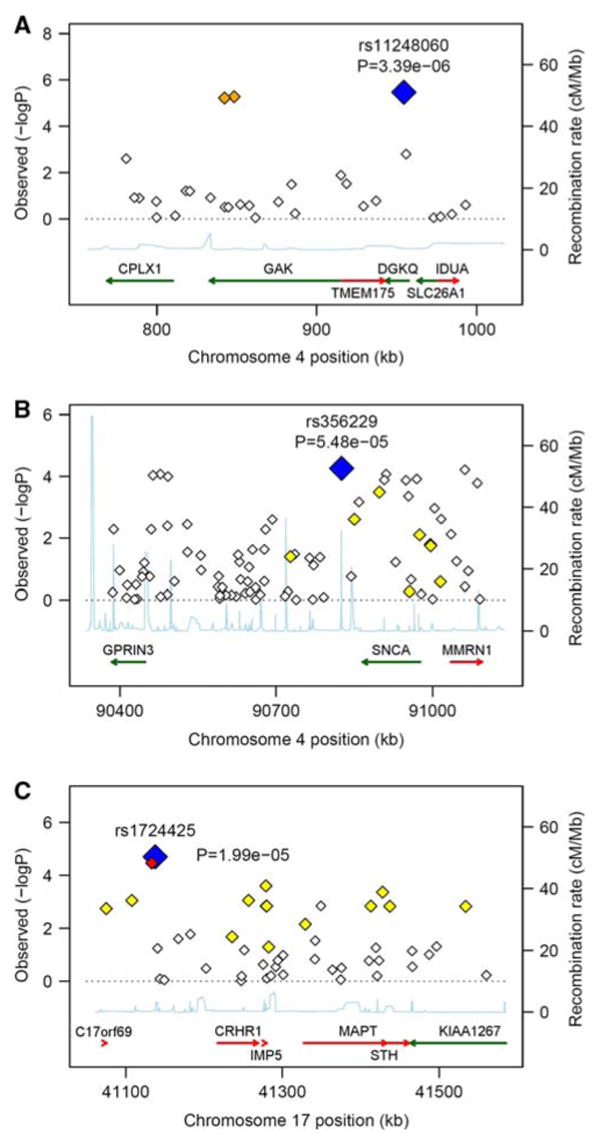
Five genes have been identified that contribute to Mendelian forms of Parkinson disease (PD); however, mutations have been found in fewer than 5% of patients, suggesting that additional genes contribute to disease risk. Unlike previous studies that focused primarily on sporadic PD, we have performed the first genomewide association study (GWAS) in familial PD. Genotyping was performed with the Illumina HumanCNV370Duo array in 857 familial PD cases and 867 controls. A logistic model was employed to test for association under additive and recessive modes of inheritance after adjusting for gender and age. No result met genomewide significance based on a conservative Bonferroni correction. The strongest association result was with SNPs in the GAK/DGKQ region on chromosome 4 (additive model: p = 3.4 x 10(-6); OR = 1.69). Consistent evidence of association was also observed to the chromosomal regions containing SNCA (additive model: p = 5.5 x 10(-5); OR = 1.35) and MAPT (recessive model: p = 2.0 x 10(-5); OR = 0.56). Both of these genes have been implicated previously in PD susceptibility; however, neither was identified in previous GWAS studies of PD. Meta-analysis was performed using data from a previous case-control GWAS, and yielded improved p values for several regions, including GAK/DGKQ (additive model: p = 2.5 x 10(-7)) and the MAPT region (recessive model: p = 9.8 x 10(-6); additive model: p = 4.8 x 10(-5)). These data suggest the identification of new susceptibility alleles for PD in the GAK/DGKQ region, and also provide further support for the role of SNCA and MAPT in PD susceptibility.
Figures
References
-
- Abecasis G, Willer C. Metal—Meta Analysis Helper 2007
-
- Barrett JC, Fry B, Maller J, Daly MJ. Haploview: analysis and visualization of LD and haplotype maps. Bioinformatics. 2005;21:263–265. - PubMed
-
- Chartier-Harlin MC, Kachergus J, Roumier C, Mouroux V, Douay X, Lincoln S, Levecque C, Larvor L, Andrieux J, Hulihan M, Waucquier N, Defebvre L, Amouyel P, Farrer M, Destee A. Alpha-synuclein locus duplication as a cause of familial Parkinson's disease. Lancet. 2004;364:1167–1169. - PubMed
-
- Defazio G, Martino D, Aniello MS, Masi G, Gigante A, Bhatia K, Livrea P, Berardelli A. Planning genetic studies on primary adult-onset dystonia: sample size estimates based on examination of first-degree relatives. J Neurol Sci. 2006;251:29–34. - PubMed
-
- Foroud T, Uniacke SK, Liu L, Pankratz N, Rudolph A, Halter C, Shults C, Marder K, Conneally PM, Nichols WC. Heterozygosity for a mutation in the parkin gene leads to later onset Parkinson disease. Neurology. 2003;60:796–801. - PubMed
Publication types
MeSH terms
Substances
Grants and funding
LinkOut - more resources
Full Text Sources
Other Literature Sources
Medical
Molecular Biology Databases
Research Materials
Miscellaneous
