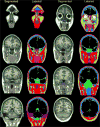
MRI-based anatomical model of the human head for specific absorption rate mapping
- PMID: 18985401
- PMCID: PMC2828153
- DOI: 10.1007/s11517-008-0414-z
MRI-based anatomical model of the human head for specific absorption rate mapping
Abstract
In this study, we present a magnetic resonance imaging (MRI)-based, high-resolution, numerical model of the head of a healthy human subject. In order to formulate the model, we performed quantitative volumetric segmentation on the human head, using T1-weighted MRI. The high spatial resolution used (1 x 1 x 1 mm(3)), allowed for the precise computation and visualization of a higher number of anatomical structures than provided by previous models. Furthermore, the high spatial resolution allowed us to study individual thin anatomical structures of clinical relevance not visible by the standard model currently adopted in computational bioelectromagnetics. When we computed the electromagnetic field and specific absorption rate (SAR) at 7 Tesla MRI using this high-resolution model, we were able to obtain a detailed visualization of such fine anatomical structures as the epidermis/dermis, bone structures, bone-marrow, white matter and nasal and eye structures.
Figures


Similar articles
-
MIDA: A Multimodal Imaging-Based Detailed Anatomical Model of the Human Head and Neck.PLoS One. 2015 Apr 22;10(4):e0124126. doi: 10.1371/journal.pone.0124126. eCollection 2015. PLoS One. 2015. PMID: 25901747 Free PMC article.
-
Atlas-based head modeling and spatial normalization for high-density diffuse optical tomography: in vivo validation against fMRI.Neuroimage. 2014 Jan 15;85 Pt 1(0 1):117-26. doi: 10.1016/j.neuroimage.2013.03.069. Epub 2013 Apr 8. Neuroimage. 2014. PMID: 23578579 Free PMC article.
-
Human brain atlas for automated region of interest selection in quantitative susceptibility mapping: application to determine iron content in deep gray matter structures.Neuroimage. 2013 Nov 15;82:449-69. doi: 10.1016/j.neuroimage.2013.05.127. Epub 2013 Jun 12. Neuroimage. 2013. PMID: 23769915 Free PMC article.
-
Fully automated whole-head segmentation with improved smoothness and continuity, with theory reviewed.PLoS One. 2015 May 18;10(5):e0125477. doi: 10.1371/journal.pone.0125477. eCollection 2015. PLoS One. 2015. PMID: 25992793 Free PMC article. Review.
-
Mapping function in the human brain with magnetoencephalography, anatomical magnetic resonance imaging, and functional magnetic resonance imaging.J Clin Neurophysiol. 1995 Sep;12(5):406-31. doi: 10.1097/00004691-199509010-00002. J Clin Neurophysiol. 1995. PMID: 8576388 Review.
Cited by
-
Forward modelling of magnetic induction tomography: a sensitivity study for detecting haemorrhagic cerebral stroke.Med Biol Eng Comput. 2009 Dec;47(12):1301-13. doi: 10.1007/s11517-009-0541-1. Epub 2009 Oct 16. Med Biol Eng Comput. 2009. PMID: 19834756
-
Multimodal magnetic resonance neuroimaging measures characteristic of early cART-treated pediatric HIV: A feature selection approach.Hum Brain Mapp. 2022 Sep;43(13):4128-4144. doi: 10.1002/hbm.25907. Epub 2022 May 16. Hum Brain Mapp. 2022. PMID: 35575438 Free PMC article.
-
Numerical and Experimental Analysis of Radiofrequency-Induced Heating Versus Lead Conductivity During EEG-MRI at 3 T.IEEE Trans Electromagn Compat. 2019 Jun;61(3):852-859. doi: 10.1109/TEMC.2018.2840050. Epub 2018 Jun 25. IEEE Trans Electromagn Compat. 2019. PMID: 31210669 Free PMC article.
-
A Virtual Patient Simulator Based on Human Connectome and 7 T MRI for Deep Brain Stimulation.Int J Adv Life Sci. 2014;6(3-4):364-372. Int J Adv Life Sci. 2014. PMID: 25705324 Free PMC article.
-
Analysis of the role of lead resistivity in specific absorption rate for deep brain stimulator leads at 3T MRI.IEEE Trans Med Imaging. 2010 Apr;29(4):1029-38. doi: 10.1109/TMI.2010.2040624. Epub 2010 Mar 22. IEEE Trans Med Imaging. 2010. PMID: 20335090 Free PMC article.
References
Publication types
MeSH terms
Grants and funding
LinkOut - more resources
Full Text Sources
Other Literature Sources
Miscellaneous

