. 2008 Nov 6:2:95.
doi: 10.1186/1752-0509-2-95.

Integrated weighted gene co-expression network analysis with an application to chronic fatigue syndrome

Affiliations

Integrated weighted gene co-expression network analysis with an application to chronic fatigue syndrome

Angela P Presson et al. BMC Syst Biol. .

Abstract

Background: Systems biologic approaches such as Weighted Gene Co-expression Network Analysis (WGCNA) can effectively integrate gene expression and trait data to identify pathways and candidate biomarkers. Here we show that the additional inclusion of genetic marker data allows one to characterize network relationships as causal or reactive in a chronic fatigue syndrome (CFS) data set.

Results: We combine WGCNA with genetic marker data to identify a disease-related pathway and its causal drivers, an analysis which we refer to as "Integrated WGCNA" or IWGCNA. Specifically, we present the following IWGCNA approach: 1) construct a co-expression network, 2) identify trait-related modules within the network, 3) use a trait-related genetic marker to prioritize genes within the module, 4) apply an integrated gene screening strategy to identify candidate genes and 5) carry out causality testing to verify and/or prioritize results. By applying this strategy to a CFS data set consisting of microarray, SNP and clinical trait data, we identify a module of 299 highly correlated genes that is associated with CFS severity. Our integrated gene screening strategy results in 20 candidate genes. We show that our approach yields biologically interesting genes that function in the same pathway and are causal drivers for their parent module. We use a separate data set to replicate findings and use Ingenuity Pathways Analysis software to functionally annotate the candidate gene pathways.

Conclusion: We show how WGCNA can be combined with genetic marker data to identify disease-related pathways and the causal drivers within them. The systems genetics approach described here can easily be used to generate testable genetic hypotheses in other complex disease studies.


Figures
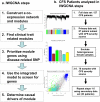
Figure 1
Figure 1
a. Flow chart overview of methods and b. subsets of patients analyzed at each step. We first constructed a co-expression network based on 127 CFS samples and then identified a CFS severity-related module using a subset of 87 patients with CFS severity scores. We then related the SNPs and connectivities to the module gene expressions in both the males and homogenized female samples separately. We selected candidate genes based on 1) association with a SNP that in turn was associated with severity, 2) connectivity, and 3) association with severity in both sexes. We then repeated analysis steps 1–5 on a second data set.
Figure 2
Figure 2
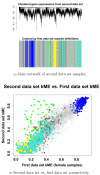
Graphical representations of network properties. (a) Hierarchical clustering of the 2677 most varying and connected genes resulted in five modules. (b) A multi-dimensional scaling plot of these genes indicates that the blue module is the most distinct. (c) There is little relationship between male and female gene expression correlations with CFS severity, likely due to genetic heterogeneity in the female samples. (d) Homogenizing the female samples more than doubled the correlation between M and FH gene significance. (e) Connectivities of the module genes are similar between males (M) and females (F) and (f) males and homogenized females (FH), with the blue module showing the highest preservation. The fact that intramodular connectivity is highly preserved forms the foundation of a connectivity and network-based screening strategy.
Figure 3
Figure 3
Male and female gene significance bar plots for CFS severity. We found that the blue module gene significance was highest in (a) all samples and in (b) males. In females (c) the blue module significance was approximately equal to the average significance of the other modules. (d) Homogenizing the female samples increased and emphasized the blue module significance.
Figure 4
Figure 4
Secondary data set results. (a) Average linkage hierarchical clustering of the gene expressions from 33 secondary data set samples colored by the original network module definitions shows that the blue module is preserved. (b) Intramodular connectivity is preserved between the secondary and primary data set networks.
Figure 5
Figure 5
Ingenuity Pathway Analysis results. An IPA comparison analysis indicates that the 20 candidate gene pathway (light blue) is connected with several of the most highly significant blue module pathways (dark blue). Each pathway description was selected from the top three most significant IPA pathway annotations, and the other two are listed below the diagram. The ranks correspond to the p-values of the identified networks, where the network with the smallest p-value has rank = 1.
Figure 6
Figure 6
Boxplot comparisons of correlation distributions for the 20 candidate genes from the IWGCNA and the 29 candidate genes from the standard analysis. The correlations with severity are higher among the standard analysis candidate genes, but the MEblue and TPH2 SNP correlations are higher for the IWGCNA candidates.

Similar articles

Cited by

References

    1. Zhou L, Ma X, Sun F. The effects of protein interactions, gene essentiality and regulatory regions on expression variation. BMC Syst Biol. 2008;2:54. doi: 10.1186/1752-0509-2-54. - DOI - PMC - PubMed
    1. Shieh GS, Chen CM, Yu CY, Huang J, Wang WF, Lo YC. Inferring transcriptional compensation interactions in yeast via stepwise structure equation modeling. BMC Bioinformatics. 2008;9:134. doi: 10.1186/1471-2105-9-134. - DOI - PMC - PubMed
    1. Wei H, Persson S, Mehta T, Srinivasasainagendra V, Chen L, Page GP, Somerville C, Loraine A. Transcriptional coordination of the metabolic network in Arabidopsis. Plant Physiol. 2006;142:762–74. doi: 10.1104/pp.106.080358. - DOI - PMC - PubMed
    1. Stuart JM, Segal E, Koller D, Kim SK. A gene-coexpression network for global discovery of conserved genetic modules. Science. 2003;302:249–55. doi: 10.1126/science.1087447. - DOI - PubMed
    1. Emilsson V, Thorleifsson G, Zhang B, Leonardson AS, Zink F, Zhu J, Carlson S, Helgason A, Walters GB, Gunnarsdottir S, Mouy M, Steinthorsdottir V, Eiriksdottir GH, Bjornsdottir G, Reynisdottir I, Gudbjartsson D, Helgadottir A, Jonasdottir A, Styrkarsdottir U, Gretarsdottir S, Magnusson KP, Stefansson H, Fossdal R, Kristjansson K, Gislason HG, Stefansson T, Leifsson BG, Thorsteinsdottir U, Lamb JR, Gulcher JR, Reitman ML, Kong A, Schadt EE, Stefansson K. Genetics of gene expression and its effect on disease. Nature. 2008;452:423–8. doi: 10.1038/nature06758. - DOI - PubMed

Publication types

Substances