. 2008 Sep;55(9):2066-78.
doi: 10.1109/TUFFC.898.

Real-time 3-D ultrasound guidance of interventional devices

Affiliations

Real-time 3-D ultrasound guidance of interventional devices

Edward D Light et al. IEEE Trans Ultrason Ferroelectr Freq Control. 2008 Sep.

Abstract

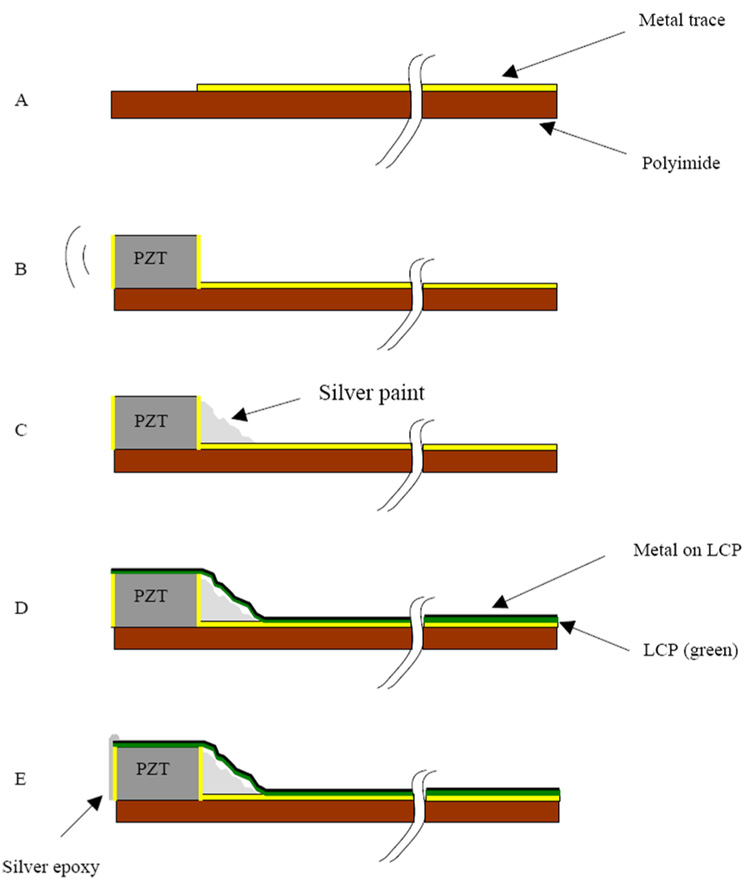
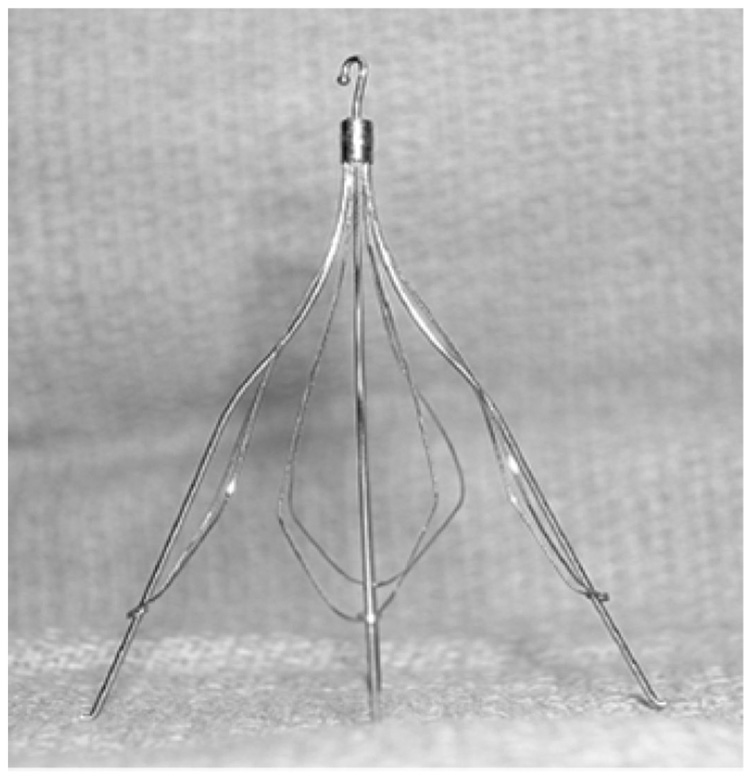
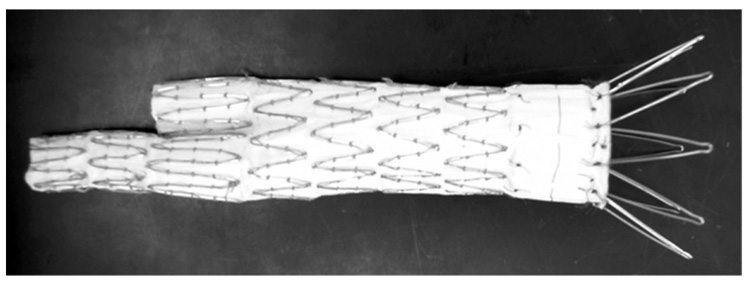
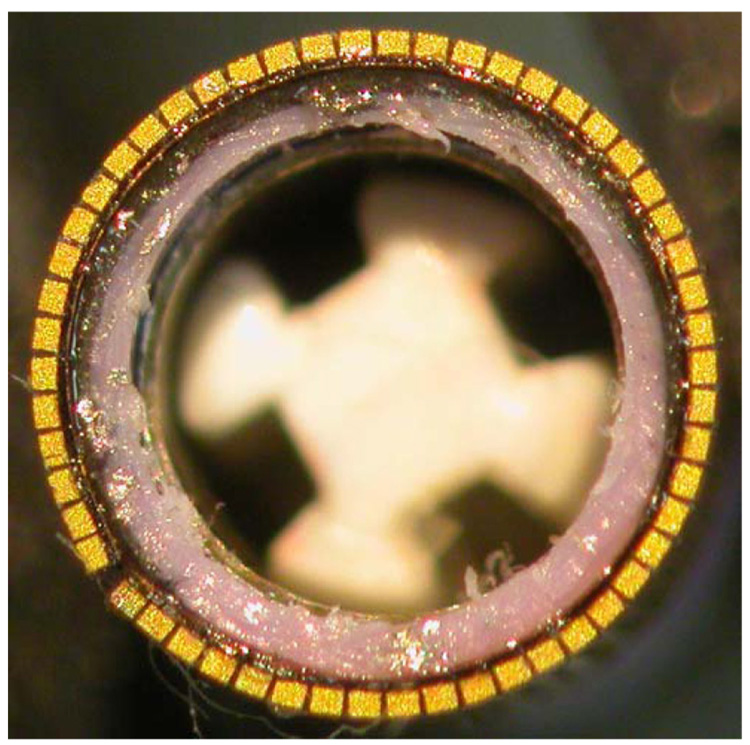
We have previously developed 2-D array transducers for many real-time volumetric imaging applications. These applications include transducers operating up to 7 MHz for transthoracic imaging, up to 15 MHz for intracardiac echocardiography (ICE), 5 MHz for transesophageal echocardiography (TEE) and intracranial imaging, and 7 MHz for laparoscopic ultrasound imaging (LUS). Now we have developed a new generation of miniature ring-array transducers integrated into the catheter deployment kits of interventional devices to enable real-time 3-D ultrasound scanning for improved guidance of minimally invasive procedures. We have constructed 3 new ring transducers. The first consists of 54 elements operating at 5 MHz. Typical measured transducer element bandwidth was 25%, and the 50 Ohm round trip insertion loss was -65 dB. Average nearest neighbor cross talk was -23.8 dB. The second is a prototype 108-element transducer operating at 5 MHz. The third is a prototype 108-element ring array with a transducer center frequency of 8.9 MHz and a -6 dB bandwidth of 25%. All transducers were integrated with an 8.5 French catheter sheath of a Cook Medical, Inc. vena cava filter deployment device.


Figures

Fig. 1
Fig. 1
Schematic of the pyramidal scan from catheter 2-D array transducer. Bold lines indicate possible display planes. By integrating and spatially filtering between 2 user-selected planes, real-time 3-D rendered images are displayed.
Fig. 2
Fig. 2
(a)The Field II simulated 54-element aperture and (b)beam response of a 5 MHz ring array transducer focused on axis at 5 mm. The predicted − 6dB beamwidth is 3.8°formula image.
Fig. 3
Fig. 3
(a) Field II simulated 108-element aperture and the on axis beam response from that aperture at (b) 5 MHz, (c) 7.5 MHz, and (d) 10 MHz. Focus is at 5 mm. The elevation only plot is shown for simplicityformula image.
Fig. 4
Fig. 4
(a) Field II simulated 108-element aperture and the on axis beam response from that aperture at (b) 5 MHz, (c) 7.5 MHz, and (d) 10 MHz. Focus is at 5 mm. The elevation only plot is shown for simplicity.
Fig. 5
Fig. 5
A top view photograph showing a subset of metal traces on polyimide and the shelf area where the PZT is bonded. This part was made by MicroConnex, Inc., and the traces are on 0.10 mm spacing. The signal traces are the lighter color, the polyimide the darkerformula image.
Fig. 6
Fig. 6
Schematic showing the construction steps in building a ring-array transducer. (a) We start with a metallized polyimide substrate with an area without the metal to attach the PZT. (b) We next attach the PZT beam with nonconductive epoxy. (c) After the epoxy cures, silver paint is used to connect the back electrode of the PZT with the metal trace. The PZT is then diced and wrapped around the catheter lumen. (d) A 0.012 mm thick layer of liquid crystal polymer (LCP) is wrapped around the outer circumference of the PZT and polyimide substrate. This LCP layer is metallized with gold (shown in black) on one side only, the outer side, so that it does not risk shorting the traces together. (e) Finally, a layer of silver epoxy is spread on the face of the elements and connected to the gold on the outside of the LCP. This conductive layer is attached to the ground returns on the MicroMiniature ribbon cable from W. L. Gore and Associatesformula image.
Fig. 7
Fig. 7
Photograph of Cook Medical Günther Tulip vena cava filter.
Fig. 8
Fig. 8
Photograph of the Cook Zenith AAA Endovascular Graft.
Fig. 9
Fig. 9
Closeup of ring array after dicing and bonding to the catheter lumenformula image.
Fig. 10
Fig. 10
Completed integrated device showing the MicroMiniature ribbon cables (MC) and the Cook Medical vena cava filter (F) sticking out the lumen of the catheterformula image.
Fig. 11
Fig. 11
(a) Typical pulse and (b) spectrum from the integrated transducer/VC filter deployment device. The center frequency is 4.9 MHz and the −6 dB bandwidth is 25%.
Fig. 12
Fig. 12
Angular response of a single element (black circles and dashed line) from the 5 MHz, 54-element transducer plotted with the theoretical response (solid black line). These data were taken in the radial direction, not circumferential.
Fig. 13
Fig. 13
(a) A 7 cm deep B-scan and (b) a simultaneous real-time inclined C-scan of the vena cava filter (F) pictured in Fig. 7. The images were acquired in a water tank with a 54-element ring-array transducer integrated with the Cook Medical deployment kit. We see the filter (F) and rubber (R) on which it rests in both images. (b) also shows 3 of the main struts (MS) of the filter and the thinner wires that give it the tulip shape.
Fig. 14
Fig. 14
(a) Simultaneous X-ray and (c)–(d) ultrasound images of agitated X-ray contrast. The X-ray image shows the Cook Medical aortic stent graft (G), our completed catheter (I) with its transducer tip (T), and the flow of the X-ray contrast (CF). (b) shows a cross-sectional rendered view of the stent graft (G) made with the 54-element 5 MHz transducer. Fig. 14(c) shows a 4 cm deep B-scan with color flow Doppler of the agitated contrast showing flow away from the transducer. (d) is a C-scan plane showing the 2 bifurcated legs of the graft (G) and Doppler flow away from the transducer. The plane was taken at the level indicated by the arrows in Fig. 14(c)formula image.
Fig. 15
Fig. 15
Photograph of the 108-element 8.9 MHz ring array after dicing and bonding to the 11 French catheter of the Cook Medical vena cava filter deployment kitformula image.
Fig. 16
Fig. 16
(a) Typical pulse and (b) spectrum from the 5 MHz 108-element ring-array transducer. The center frequency is 4.7 MHz and the −6 dB bandwidth is 21%.
Fig. 17
Fig. 17
(a) Typical pulse and (b) spectrum from the 8.9 MHz 108-element ring array transducer. The center frequency is 8.9 MHz and the −6 dB bandwidth is 26%.
Fig. 18
Fig. 18
Angular response of a single element (black circles and dashed line) from the 5 MHz, 54-element transducer plotted with the new theoretical response (solid black line). These new theoretical data assume a larger element size due to acoustic coupling with the 0.075 mm thick polyimide layer.

Similar articles

Cited by

References

    1. Smith SW, Trahey GE, von Ramm OT. Two-dimensional arrays for medical ultrasound. Ultrason. Imag. 1992;vol. 14(no 3):213–233. - PubMed
    1. Light ED, Davidsen RE, Hrushka TA, Smith SW. Progress in two-dimensional arrays for real time volumetric imaging. Ultrason. Imag. 1998;vol. 20(no 1):1–16. - PubMed
    1. Light ED, Fiering JO, Hultman PA, Lee W, Smith SW. Update of two dimensional arrays for real time volumetric and real time intracardiac imaging; Proc. IEEE Trans. Ultrasonics Symp; 1999. pp. 1217–1220.
    1. Light ED, Idriss SF, Wolf PD, Smith SW. Real time three dimensional intracardiac echocardiography. Ultrasound Med. Biol. 2001;vol. 27(no 9):1177–1183. - PubMed
    1. Lee W, Idriss SF, Wolf PD, Smith SW. A miniaturized catheter 2-D array for real-time 3D intracardiac echocardiography. IEEE Trans. Ultrason. Ferroelectr. Freq. Control. 2004;vol. 51(no 10):1334–1346. - PubMed

Publication types

MeSH terms