. 2009 Sep 6;6(38):775-91.
doi: 10.1098/rsif.2008.0394. Epub 2008 Nov 4.

A metapopulation modelling framework for gonorrhoea and other sexually transmitted infections in heterosexual populations

Affiliations

A metapopulation modelling framework for gonorrhoea and other sexually transmitted infections in heterosexual populations

Mark I Chen et al. J R Soc Interface. .

Abstract

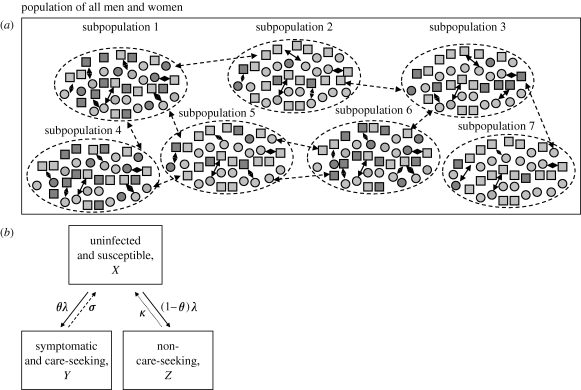
Gonorrhoea continues to be a public health problem in the UK, and is the second most common bacterial sexually transmitted infection (STI) after chlamydia. In the UK, gonorrhoea is disproportionately concentrated in epidemiologically distinct subpopulations, with much higher incidence rates in young people, some ethnic minorities and inner city subpopulations. The original model of STI transmission proposed by Hethcote and Yorke explained some of these features through the concept of the 'core group'. Since then, several authors have modified the original model approach to include multiple sexual activity classes, but found this modelling approach to be inadequate when applied to low-prevalence settings such as the UK. We present a metapopulation framework for modelling gonorrhoea and other STIs. The model proposes that the epidemiology of gonorrhoea is largely driven by subpopulations with higher than average concentrations of individuals with high sexual risk activity. We show how this conceptualization of gonococcal epidemiology overcomes key limitations associated with some of the prior efforts to model gonorrhoea. We also use the model to explain several epidemiological features of gonorrhoea, such as its asymmetric distribution across subpopulations, and the contextual risk experienced by members of at-risk subpopulations. Finally, we extend the model to explain the distribution of other STIs, using chlamydia as an example of a more ubiquitous bacterial STI.


Figures

Figure 1
Figure 1
(a) Representation of a MP model for sexually active heterosexual men and women. The heterosexual population comprises subpopulations with an equal number of men and women. The proportion of high-activity individuals is allowed to vary between subpopulations (light grey squares, low-activity men; dark grey squares, high-activity men; light grey circles, low-activity women; dark grey circles, high-activity women; solid two-head arrows, partnerships within subpopulations; dashed two-head arrows, partnerships between subpopulations). (b) Schematic of infection states for gonorrhoea. Individuals have three infection states: uninfected and susceptible, symptomatic and care-seeking, and non-care-seeking. Arrows represent transitions between infection states (solid arrows, λ: rate of infection from contact with infectious members of opposite gender; dashed arrows, σ: recovery rate in symptomatic care-seeking patients; dotted arrows, κ: recovery rate in non-care-seeking patients).
Figure 2
Figure 2
(a,b) Proportion of subpopulations of high-activity individuals (grey bars), proportion of general population of high- activity individuals (solid horizontal lines) and cumulative proportion of high-activity individuals (filled circles) when using ϕ=0.40. Across all subpopulations, there are fewer women than men in the high-AC, owing to the corresponding gender differences in the proportion of high-activity individuals observed in NATSAL (table 1). Approximately 20% of subpopulations would have a higher proportion of high-activity individuals than the population average, with the remaining subpopulations having slightly less than the population average. Different distributions can be generated, using different values for the distribution parameter, ϕ.
Figure 3
Figure 3
(a) Threshold partner change rate for high-activity individuals, for subpopulations with different proportions of high-activity individuals, and different proportions of sexual partnerships are exclusively from within the same subpopulation (π) (long-dashed curve, 0.5; short-dashed curve, 0.6; solid curve, 0.7; dotted curve, 0.8, dashed dotted curve, 0.9), assuming that all partnerships with the rest of the population are wasted (i.e. E j=0). Low-activity individuals are assumed to have a partner change rate of 0.5 per year. Subpopulations with a higher proportion of high-activity individuals, or where a greater proportion of sexual partnerships are with other individuals in the same subpopulation, would require a lower threshold partner change rate for a self-sustaining epidemic of gonorrhoea. (b) Mean number of new partners in high-AC individuals when assuming different cut-off points, based on NATSAL data for respondents from London. Extreme partner change rates (more than 10 per year) are observed only with a small proportion of men (less than 2%), and the highest partner change rate reported for women was 10 per year (light grey bars, percentage of men; dark grey bars, percentage of women; triangles, partner change, men; squares, partner change, women).
Figure 4
Figure 4
(a) Distribution of high-activity individuals (ϕ) and endemic incidence for π=0.7, where π is the proportion of sexual partnerships formed exclusively with those from within the same subpopulation. Lines denote different distributions of high-activity individuals. More asymmetric distributions (higher values of ϕ; blue curve, ϕ=0.3; red curve, ϕ=0.4; green curve, ϕ=0.5, violet curve, ϕ=0.6) cause a higher incidence at equilibrium, and reach this equilibrium faster. (b) Distribution of high-activity individuals (ϕ) and incidence at 50 years for different levels of within-subpopulation partnerships (π, depicted by coloured lines; light blue curve, π=0.5; dark blue curve, π=0.6; red curve, π=0.7; green curve, π=0.8; violet curve π=0.9). Dashed line shows approximate incidence observed for London, 2001. For plausible ranges of π, the observed incidence can be reproduced by an appropriate value for the distribution of high-activity individuals. (c) Lorenz curves giving cumulative distribution of cases with different levels of within-subpopulation partnerships (π) (light blue curve, π=0.5 (Gini=0.38); dark blue curve, π=0.6 (Gini=0.41); red curve, π=0.7 (Gini=0.47); green curve, π=0.8 (Gini=0.56); violet curve π=0.9 (Gini=0.73); black line, line of equality), with incidence fixed at 200 cases per 100 000 population, using the appropriate values of ϕ from (b). When subpopulations are sorted by the number of cases they produce, it becomes clear that a minority of subpopulations contribute to more cases. Deviation from the line of equality (i.e. when cases are distributed equally across all subpopulations) can be quantified in terms of the Gini coefficient (see text). Assuming that more sexual partnerships occur exclusively within the same subpopulation (π) would result in more unequal distribution of cases. (d) Distribution of high-activity individuals (ϕ) and levels of within-subpopulation partnerships (π) on incidence and Gini coefficient. Areas shaded by different colours denote the boundaries observed when assuming different levels of within-subpopulation partnerships (π) for different distributions of high-activity individuals (ϕ). Each pair of values for within-subpopulation partnerships (π) and distribution of high-activity individuals (ϕ) result in a different distribution of cases and hence a different Gini coefficient (y-axis), as well as a different incidence rate; the boundaries between different incidence rates per 100 000 population (IR) are given by the contour lines. To obtain the Gini coefficient of 0.49 observed for gonorrhoea while constraining the incidence to approximately 200 per 100 000 per year, π should lie between 0.6 and 0.8, with a corresponding value of ϕ between 0.36 and 0.48.
Figure 5
Figure 5
(a) Modelled change in incidence rates over time after seeding population. The mixing parameter for the AC model (blue curve, men; red curve, women) is set to ϵ=0.2158, to give an incidence rate of 200 cases per 100 000; the MP model (green curve, men; violet curve, women) uses π=0.7 and ϕ=0.4032. The MP model reaches its equilibrium incidence within approximately 50 years, but it takes more than 200 years for this to happen in the AC model. (b) Modelled change in incidence rates over time following a 5-day increase in the duration of care-seeking infections; other parameters as for (a). The MP model (green curve) predicts that incidence will increase by approximately 20% and stabilize at a new equilibrium in approximately 10 years, whereas the AC model (blue curve) suggests that incidence would more than double, and take approximately 50 years to reach the new equilibrium. (c) Change in equilibrium incidence with up to 10% reduction in transmission probability, with incidence expressed as a proportion relative to the baseline incidence. Equilibrium incidence was approximated by running the models until year-on-year change in incidence was less than 0.01%; other parameters are as for (a). The AC model (diamonds) predicts much larger reductions in incidence than for the MP model (squares).
Figure 6
Figure 6
(a) Modelled incidence rate for subpopulations grouped by the proportion of high-activity men. Parameters are π=0.7 and ϕ=0.4032. Subpopulations with a low proportion of high-activity men (less than 6%) have an incidence rate lower than the population average, whereas the subpopulations with the highest proportion of high-activity men (more than 9%) have an incidence rate more than 10 times the population average (blue bars, men; red bars, women). (b) Lorenz curves using the MP model for gonorrhoea-like parameters, lower and higher transmissibility, and chlamydia-like parameters. π and ϕ are as for (a). A less transmissible disease (15% reduction) would be more highly concentrated in subpopulations that have a higher proportion of high-activity individuals, whereas a more transmissible disease (15% increase) would be more evenly spread out across the subpopulation categories. Chlamydia-like parameters produce a pattern of infections that is spread out more evenly than gonorrhoea (red curve, ↓β M, β F (Gini=0.54); green curve, ↑β M, β F (Gini=0.40); blue curve, gonorrhoea (Gini=0.47); violet curve, chlamydia (Gini=0.26); black dashed line, line of equality).

Similar articles

Cited by

References

    1. Barlow D. 2008. Comment: prevalence of Neisseria gonorrhoeae infection in young subjects attending community clinics in South London. Sex. Transm. Infect. 84, 121 (10.1136/sti.2007.028423) - DOI - PubMed
    1. Becker K. M., Glass G. E., Brathwaite W., Zenilman J. M. 1998. Geographic epidemiology of gonorrhea in Baltimore, Maryland, using a geographic information system. Am. J. Epidemiol. 147, 709–716. - PubMed
    1. Bernstein K. T., Curriero F. C., Jennings J. M., Olthoff G., Erbelding E. J., Zenilman J. 2004. Defining core gonorrhea transmission utilizing spatial data. Am. J. Epidemiol. 160, 51–58. (10.1093/aje/kwh178) - DOI - PubMed
    1. Brunham R. C., Plummer F. A. 1990. A general model of sexually transmitted disease epidemiology and its implications for control. Med. Clin. North Am. 74, 1339–1352. - PubMed
    1. Chen M. I., Ghani A. C., Edmunds J. 2008. Mind the gap: the role of time between sex with two consecutive partners on the transmission dynamics of gonorrhea. Sex. Transm. Dis. 35, 435–444. (10.1097/OLQ.0b013e3181612d33) - DOI - PubMed