. 2008 Dec;36(22):7029-42.
doi: 10.1093/nar/gkn795. Epub 2008 Nov 5.

RecG interacts directly with SSB: implications for stalled replication fork regression

Affiliations

RecG interacts directly with SSB: implications for stalled replication fork regression

Jackson A Buss et al. Nucleic Acids Res. 2008 Dec.

Abstract

RecG and RuvAB are proposed to act at stalled DNA replication forks to facilitate replication restart. To define the roles of these proteins in fork regression, we used a combination of assays to determine whether RecG, RuvAB or both are capable of acting at a stalled fork. The results show that RecG binds to the C-terminus of single-stranded DNA binding protein (SSB) forming a stoichiometric complex of 2 RecG monomers per SSB tetramer. This binding occurs in solution and to SSB protein bound to single stranded DNA (ssDNA). The result of this binding is stabilization of the interaction of RecG with ssDNA. In contrast, RuvAB does not bind to SSB. Side-by-side analysis of the catalytic efficiency of the ATPase activity of each enzyme revealed that (-)scDNA and ssDNA are potent stimulators of the ATPase activity of RecG but not for RuvAB, whereas relaxed circular DNA is a poor cofactor for RecG but an excellent one for RuvAB. Collectively, these data suggest that the timing of repair protein access to the DNA at stalled forks is determined by the nature of the DNA available at the fork. We propose that RecG acts first, with RuvAB acting either after RecG or in a separate pathway following protein-independent fork regression.


Figures

Figure 1.
Figure 1.
Stabilization of RecG on ssDNA by SSB requires the C-terminus of SSB. Reactions were conducted as described in Materials and methods section. To obtain the STMP the resulting rates of ATP hydrolysis at each concentration of NaCl were calculated during each phase of the assay following addition of NaCl, and expressed as a percent of the reaction rate in the absence of added NaCl. The dashed lines indicate the STMP for each reaction. Only a single salt titration is shown for each reaction condition. The error from independent experiments is ±3 mM. (Filled circle), RecG only; (open circle), RecG + wild-type SSB; (open square), RecG + SSBΔC8 and (filled square), RecG + SSB113.
Figure 2.
Figure 2.
RecG interacts with the C-terminus of SSB protein. (A) A Coomassie-stained SDS–PAGE gel of coprecipitation assays. P, pellet; S, supernatant fractions following precipitation. The identity of each protein is indicated to the right of the gel. M, molecular weight marker. (B) Analysis of several coprecipitation gels. Error bars indicate the error from 3 to 5 independent experiments. The amount of protein present in each pellet is expressed as a fraction of the total amount added to coprecipitation experiments. This amount of protein was loaded onto gels in the adjacent lanes to permit equivalent staining and precise quantitation. (C) Analysis of gels such as that shown in (A) where coprecipitation of RecG was assayed in the presence of different SSB proteins as indicated. The amount of RecG present in pellet fractions is expressed as a fraction of the total present in the pellet and supernatant fractions. (D) RecG forms a stoichiometric complex with SSB. The analysis of 3 RecG titrations is shown. In each assay, 5 μM SSB was used and proteins were precipitated as described in Materials and methods section. The amount of RecG present in each pellet is expressed as a fraction of the total amount added to coprecipitation experiments, i.e. the total amount present in pellet and supernatant fractions as determined by analysis of Coomassie-stained SDS–PAGE gels. The amount of RecG precipitated in each titration was normalized to the maximum amount precipitated in the titration to permit comparison between assays.
Figure 3.
Figure 3.
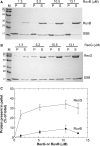
RecG and not RuvB forms a stoichiometric complex with SSB. (A) A Coomassie-stained SDS–PAGE gel of coprecipitation assays with RuvB and SSB. (B) A Coomassie-stained SDS–PAGE gel of coprecipitation assays with RecG and SSB. The concentration of ammonium sulfate used in panels A and B was 0.85 M. The reactions are otherwise identical to those in Figure 2. M, molecular weight marker; P, pellet; S, supernatant fractions. (C) Quantitation of protein coprecipitation assays. The analysis is of three separate assays for each protein done using 0.85 M ammonium sulfate and includes the gels shown in panels A and B. The amount of protein precipitated is expressed as a fraction of the total amount detected in the P and S lanes of each reaction.
Figure 4.
Figure 4.
RecG and SSB form a stable complex on ssDNA. Gel analysis of relevant fractions from gel filtration elution profiles is shown. Complexes were formed on ice for 30 min prior to subjecting them to gel filtration. Immediately before loading, the salt concentration was adjusted to 150 mM to match that of the column running buffer. The reactions shown contained binding buffer as indicated in Materials and methods section and 200 µM M13 ssDNA, 20 µM SSB and either 20 µM RecG or RuvB. Top panel, a silver-stained SDS–PAGE gel; bottom panel an agarose gel stained with ethidium bromide. For each fraction, identical volumes were loaded onto each gel. The relevant bands are indicated to the right of each gel. The position of migration of each protein band was determined relative to molecular weight markers and for M13 ssDNA, a combination of DNA ladder and M13 ssDNA was used (not shown). Lanes 1 and 2, fractions from the SSB-DNA peak; lanes 3 and 4, the RecG-SSB-ssDNA peak; lane 5, free RecG which eluted from the column at a later time; lanes 6 and 7, the putative SSB-RuvB-ssDNA peak and lane 8, free RuvB which eluted later than the SSB-DNA peak. The small amount of more slowly migrating species in lane 6 of the SDS–PAGE gel is the result of a small amount of RecG from lane 5.
Figure 5.
Figure 5.
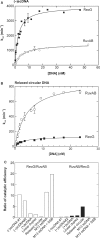
The preferred cofactor for RecG is (−)scDNA whereas for RuvAB it is relaxed circular DNA. (A) (−)scDNA and (B) relaxed circular DNA. ATPase assays were performed as described in Materials and methods section and were initiated by the addition of protein. The assays for each DNA cofactor were done at the optimal Mg+2 concentration for that cofactor as determined previously for RecG or in separate assays for RuvAB [this work and (44,45,49)]. Time courses were analyzed by linear regression to determine reaction rate and the resulting rates are graphed as a function of DNA concentration. RecG was present at 100 nM and RuvAB was present at 167 nM complex. Data were fit to the Hill equation (78), (V = (Vmax.[ATP]n)/([S0.5]n + [ATP]n). The data presented are from 2 to 4 experiments per DNA cofactor per enzyme with assays conducted on separate days. (C) The ratio of catalytic efficiency is influenced by the DNA cofactor. ATPase assays and subsequent data analyses for each DNA cofactor were conducted exactly as described in panels A and B. The catalytic efficiency for each enzyme (i.e. the ratio of kcat/kmDNA, app) in the presence of each DNA cofactor was calculated and expressed as a ratio of RecG to RuvAB (white bars) or RuvAB to RecG (black bars).
Figure 6.
Figure 6.
DNA topology influences the timing of protein loading at stalled replication forks. A model of the topological domains of a segment of the E. coli chromosome undergoing replication is shown. This figure is adapted from (44). Parental DNA is colored blue and nascent daughter DNA is colored red with arrowheads indicating 3′-ends. Once the fork encounters a block, one of several temporally spaced events may occur. (I) If DNA gyrase acts prior to the dissociation of the replication machinery (i.e. within the 5–7 min window following fork stalling), the (+)scDNA is converted to (−)scDNA. RecG binds to the (−)scDNA and drives fork regression. (II) If the replisome disassembles exposing a gap in the lagging strand, the gap will be rapidly bound by SSB (grey spheres). RecG binds and together they coexist on ssDNA to stabilize and/or reverse the fork. (III) The replication machinery disassembles from the DNA, releasing superhelical tension leading to protein-independent fork regression. The nascent, relaxed DNA is the preferred cofactor for RuvAB.

References

    1. Kogoma T. Stable DNA replication: interplay between DNA replication, homologous recombination, and transcription. Microbiol. Mol. Biol. Rev. 1997;61:212–238. - PMC - PubMed
    1. Kuzminov A. Recombinational repair of DNA damage in Escherichia coli and bacteriophage lambda. Microbiol. Mol. Biol. Rev. 1999;63:751–813. - PMC - PubMed
    1. Kowalczykowski SC. Initiation of genetic recombination and recombination-dependent replication. Trends Biochem. Sci. 2000;25:156–165. - PubMed
    1. Seigneur M, Bidnenko V, Ehrlich SD, Michel B. RuvAB acts at arrested replication forks. Cell. 1998;95:419–430. - PubMed
    1. Cox MM, Goodman MF, Kreuzer KN, Sherratt DJ, Sandler SJ, Marians KJ. The importance of repairing stalled replication forks. Nature. 2000;404:37–41. - PubMed

Publication types

MeSH terms