. 2009 Jan;37(Database issue):D720-30.
doi: 10.1093/nar/gkn778. Epub 2008 Nov 5.

Mouse phenome database

Affiliations

Mouse phenome database

Stephen C Grubb et al. Nucleic Acids Res. 2009 Jan.

Abstract

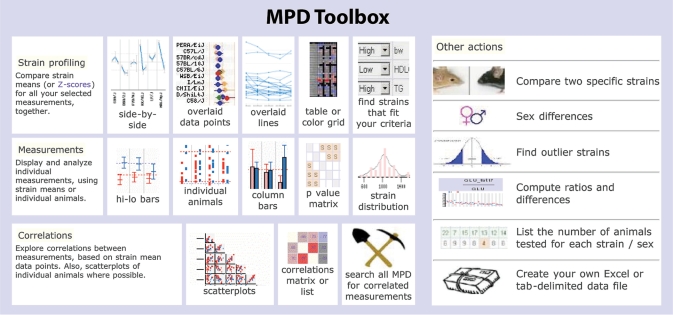
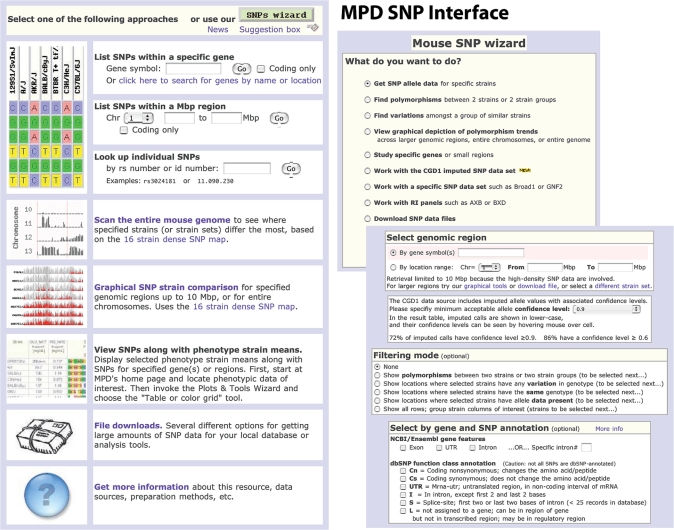
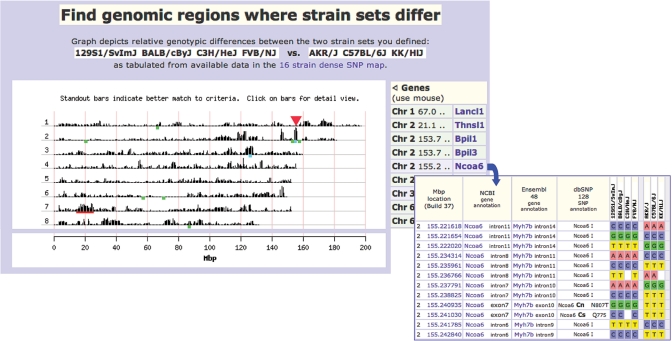
The Mouse Phenome Database (MPD; http://www.jax.org/phenome) is an open source, web-based repository of phenotypic and genotypic data on commonly used and genetically diverse inbred strains of mice and their derivatives. MPD is also a facility for query, analysis and in silico hypothesis testing. Currently MPD contains about 1400 phenotypic measurements contributed by research teams worldwide, including phenotypes relevant to human health such as cancer susceptibility, aging, obesity, susceptibility to infectious diseases, atherosclerosis, blood disorders and neurosensory disorders. Electronic access to centralized strain data enables investigators to select optimal strains for many systems-based research applications, including physiological studies, drug and toxicology testing, modeling disease processes and complex trait analysis. The ability to select strains for specific research applications by accessing existing phenotype data can bypass the need to (re)characterize strains, precluding major investments of time and resources. This functionality, in turn, accelerates research and leverages existing community resources. Since our last NAR reporting in 2007, MPD has added more community-contributed data covering more phenotypic domains and implemented several new tools and features, including a new interactive Tool Demo available through the MPD homepage (quick link: http://phenome.jax.org/phenome/trytools).


Figures

Figure 1.
Figure 1.
MPD Toolbox. Screenshot of MPD analysis tools, grouped by function: strain profiling (identifying mouse models with specific characteristics), measurement displays, correlations, and other actions. Some of our new tools are featured elsewhere: side-by-side plot and color-grid are shown in Figure 5, the overlaid-data-points plot in Figures 4 and 6. Try the interactive Tool Demo from the MPD homepage or go to http://phenome.jax.org/phenome/trytools.
Figure 2.
Figure 2.
MPD SNP interface tools for retrieval and filtering SNPs. SNPs may be retrieved by gene symbol or genomic location (left panel), or by more complex criteria. A SNP wizard (top right) has been added to assist users, showing possible options for each retrieval method. Users must select the optimal SNP dataset for their particular research application (see text for details). MPD provides information about each dataset to facilitate the process. To narrow SNP results as much as possible, options for additional criteria are offered (right panel), such as various filtering modes or by annotations (Ensembl, NCBI, MGI). An option to set the confidence interval for imputed SNPs is provided for the CGD SNP dataset (see text for more details and Figure 7).
Figure 3.
Figure 3.
Mouse strain coat color and appearance. Sixty strains have been professionally photographed under standardized conditions (lighting, background, etc.). Four strains are shown here to illustrate the wide range of phenotypes found in laboratory strains for coat color and appearance. DBA/2J is one of the oldest inbred strains in existence. BTBR T+tf/J, an inbred strain developed more recently, has a severe defect in corpus collosum development and exhibits extreme behavioral phenotypes. JF1/Ms, a wild-derived inbred strain from Japan (10), has congenital eye abnormalities (Figure 4) and has remarkably high percent body fat although its total body weight is relatively low compared to other strains; and B6.Cg-Ay/J is a congenic strain that exhibits severe obesity-related phenotypes. MPD contains data for inbred strains and their derivatives, such as congenic, consomic and recombinant inbred strains. Photographs by Stanton Short, The Jackson Laboratory.
Figure 4.
Figure 4.
Retinal degeneration. Forty inbred strains were examined for eye abnormalities (retina, cornea, lens, iris). Twenty-five percent of the strains exhibit retinal degeneration by 6–7 weeks of age. This study underscores the importance of using strain characteristics data to choose optimal strains for testing. An investigator using a behavioral apparatus that uses visual cues for scoring would not choose JF1/Ms for the study. Without knowing that JF1 has severe vision problems, the investigator might incorrectly conclude that JF1 is unintelligent, anxious or lethargic. Data from Hawes1 MPD:267 (2008).
Figure 5.
Figure 5.
New phenotype tools for strain profiling and identifying important new mouse models for research. The Jackson Aging Center is in the process of testing 32 inbred strains for a wide variety of phenotypic traits at 6, 12, 18 and 24 months of age. A new tool has been developed to visualize aging trends graphically (above). In this example, three time points for thyroxine (T4) are shown for each strain. Such a tool is critical for understanding aging processes which are not always linear over time. This tool helped identify several complex phenotypes which would not have been discovered if examining only one time point. Another new tool useful for identifying mouse models in shown in the lower panel. The color grid tool is based on the heat map concept using Z-scores. Strain names are listed on the left, measurement numbers are shown along the top (1–6) which are fully defined below the grid when viewing online. Shades of red indicate those measurements that are above the overall mean and blue indicates those that are below. Intensity of color tracks with severity, where the more intense colors are the most extreme. More new tools are featured in Figure 6. Data (upper) from Yuan3 MPD:244 (2008); (lower) Churchill1 MPD:171 (2004).
Figure 6.
Figure 6.
MPD measurement categories and using metadata to organize displays. When new MPD measurements are accessioned, they are classified based on the trait measured and experimental context. In this example, when a set of data containing three triglyceride measurements was submitted to MPD (projects are given a symbol, e.g. Albers1), each measurement was annotated (metadata) to reflect the population tested, the experimental methods (baseline vs. intervention of high fat diet for 6 weeks), and biological parameters (age). The lower panel shows the older MPD display where the metadata is included in every row. The middle panel shows the same measurements and illustrates our new method of displaying measurements based on common metadata. Although redundancy is diminished, each measurement still retains all its originally annotated metadata which is visible in other website views. The grouping display is now the default when browsing by category, but users may toggle between viewing options. The new classification scheme is amenable to adding comparison views. In this case, a plot is generated that shows a diet-effect comparison (click on link at green arrow) showing all three measurements in a single plot. Blue arrow: ‘?’ is a quick link to the protocol and the shopping cart icon is for flagging measurements to create customized datasets, an advanced MPD feature not discussed here. The upper panel illustrates a new feature to show consensus views of related measurements across multiple projects (red arrow). The thumbnail view shows baseline triglyceride levels from four different MPD projects. Strain sets may not overlap 100% as shown here where some strains were tested by only two projects and other strains were tested by all four projects. Albers1 MPD:8 (1999).
Figure 7.
Figure 7.
Find Genomic Regions. This new tool is based on the concept of identity by decent (IBD) regarding ancestral inheritance in inbred strains of mice, and on the assumption that phenotypic differences reflect genotypic differences. Therefore, finding regions of the genome that are different between strains with differing phenotypes of interest may help identify causal genes or regulatory regions contributing to the differences in phenotype. Here is an example: a measurement reveals polar phenotypes among strains so that high- and low-end outliers can be grouped (Low: 129S1/SvImJ, BALB/cByJ, C3H/HeJ, FVB/NJ; High: AKR/J, C57BL/6J, KK/HlLtJ) and entered as such in the set up window. The tool is deployed to scan the mouse genome and plot regions where the Low group is most different from the High group (top panel, truncated to show Chr 1–8 only). Genes and other regions of interest can be superimposed on the plot, including user-specified genes (blue), genomic coordinates (red), and locations where genes have been annotated (MGI) with keywords that the user enters (green). Genes and coordinates are listed to the right of the plot. The user can progressively zoom in on particular regions, all the way to listings of individual SNPs. In this example, we drilled down on the 5 Mbp interval on Chr 2 (152–157 Mbp; red arrow), and found this region contains >16K SNP locations and 139 annotated genes. Filtering our SNP retrieval by limiting it to polymorphic locations between our High and Low strain sets, we reduced the region to <3K SNPs. Several genes including Ncoa6 (lower panel) meet our criteria and might be considered good candidate genes for our phenotype. The SNP retrieval shows merged-in annotation from NCBI, Ensembl, and dbSNP. I = intron, Cs = coding synonymous (amino acid (aa) and aa position in the peptide); Cn = coding nonsynonymous (aa encoded, position, aa change).

Similar articles

Cited by

References

    1. Bogue M. Mouse Phenome Project: understanding human biology through mouse genetics and genomics. J. Appl. Physiol. 2003;95:1335–1337. - PubMed
    1. Grubb SC, Churchill GA, Bogue MA. A collaborative database of inbred mouse strain characteristics. Bioinformatics. 2004;20:2857–2859. - PubMed
    1. Mouse Phenotype Database Integration Consortium. Hancock JM, Adams NC, Aidinis V, Blake A, Bogue M, Brown SD, Chesler EJ, Davidson D, Duran C, Eppig JT, et al. Mouse Phenotype Database Integration Consortium: integration [corrected] of mouse phenome data resources. Mamm. Genome. 2007;18:157–163. (Errata in: Mamm. Genome. 2007; 18, 815. Mamm. Genome. 2008; 19, 219–220). - PMC - PubMed
    1. Taylor CF, Field D, Sansone SA, Aerts J, Apweiler R, Ashburner M, Ball CA, Binz PA, Bogue M, Booth T, et al. Promoting coherent minimum reporting guidelines for biological and biomedical investigations: the MIBBI project. Nat. Biotechnol. 2008;26:889–896. - PMC - PubMed
    1. Bogue MA, Grubb SC, Maddatu TP, Bult CJ. Mouse Phenome Database (MPD) Nucleic Acids Res. 2007;35:D643–D649. - PMC - PubMed

Publication types