. 2009 Jan;101(1):437-47.
doi: 10.1152/jn.90959.2008. Epub 2008 Nov 5.

Measuring and modeling the interaction among reward size, delay to reward, and satiation level on motivation in monkeys

Affiliations

Measuring and modeling the interaction among reward size, delay to reward, and satiation level on motivation in monkeys

Takafumi Minamimoto et al. J Neurophysiol. 2009 Jan.

Abstract

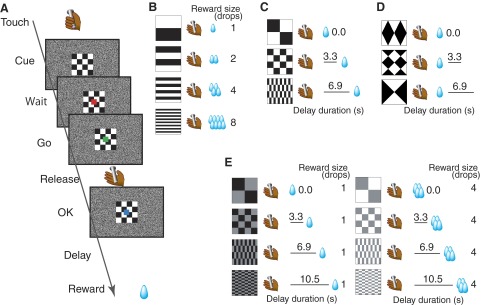
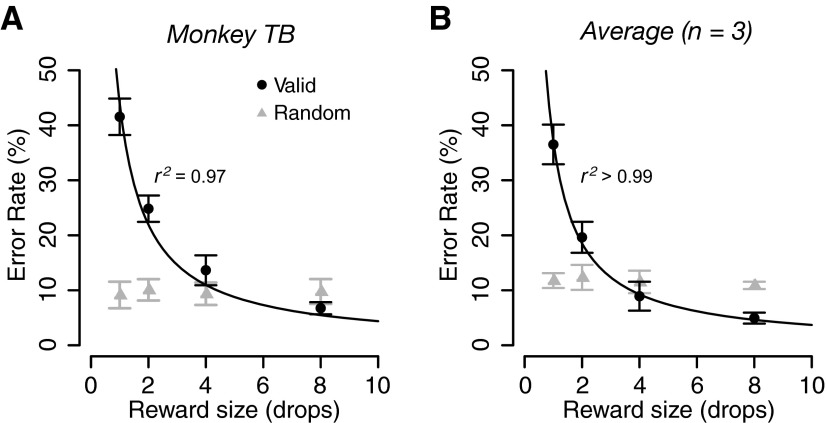
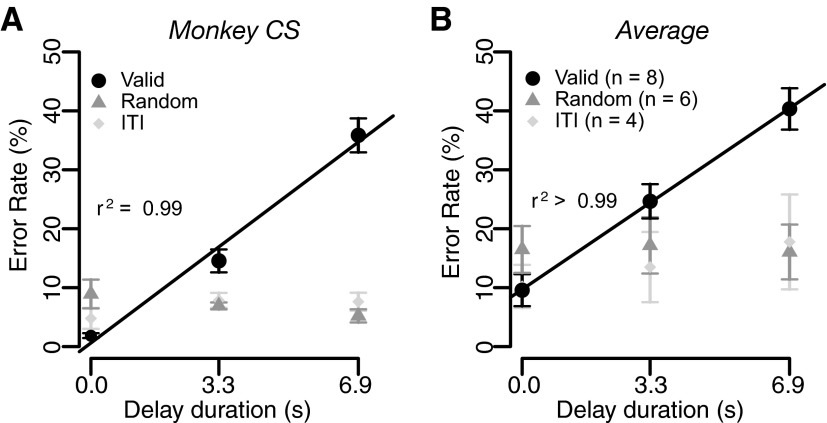
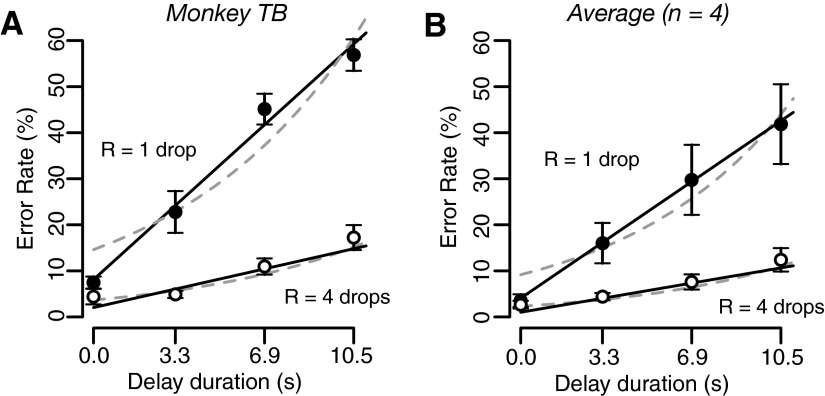
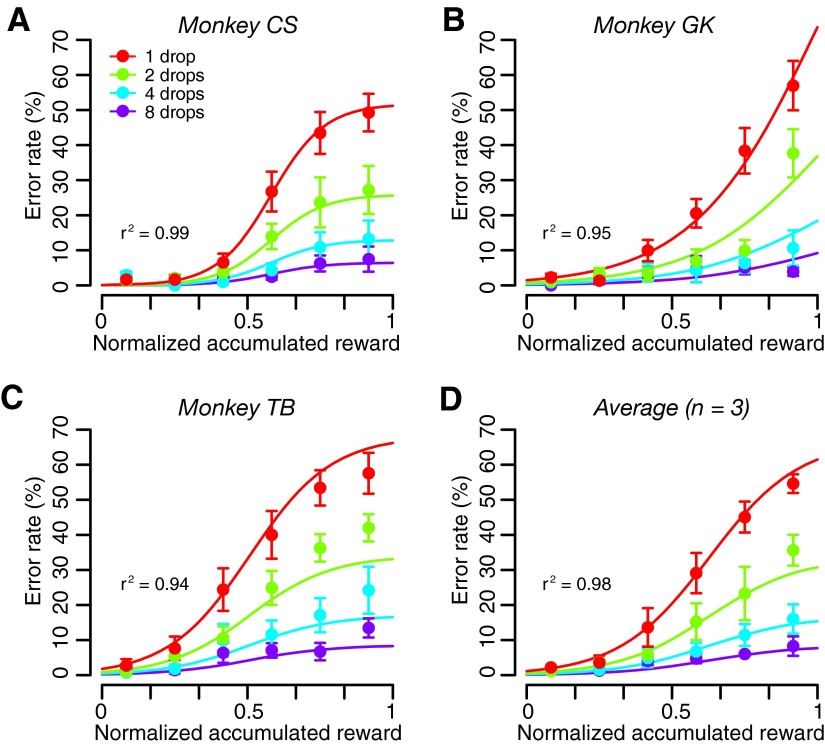
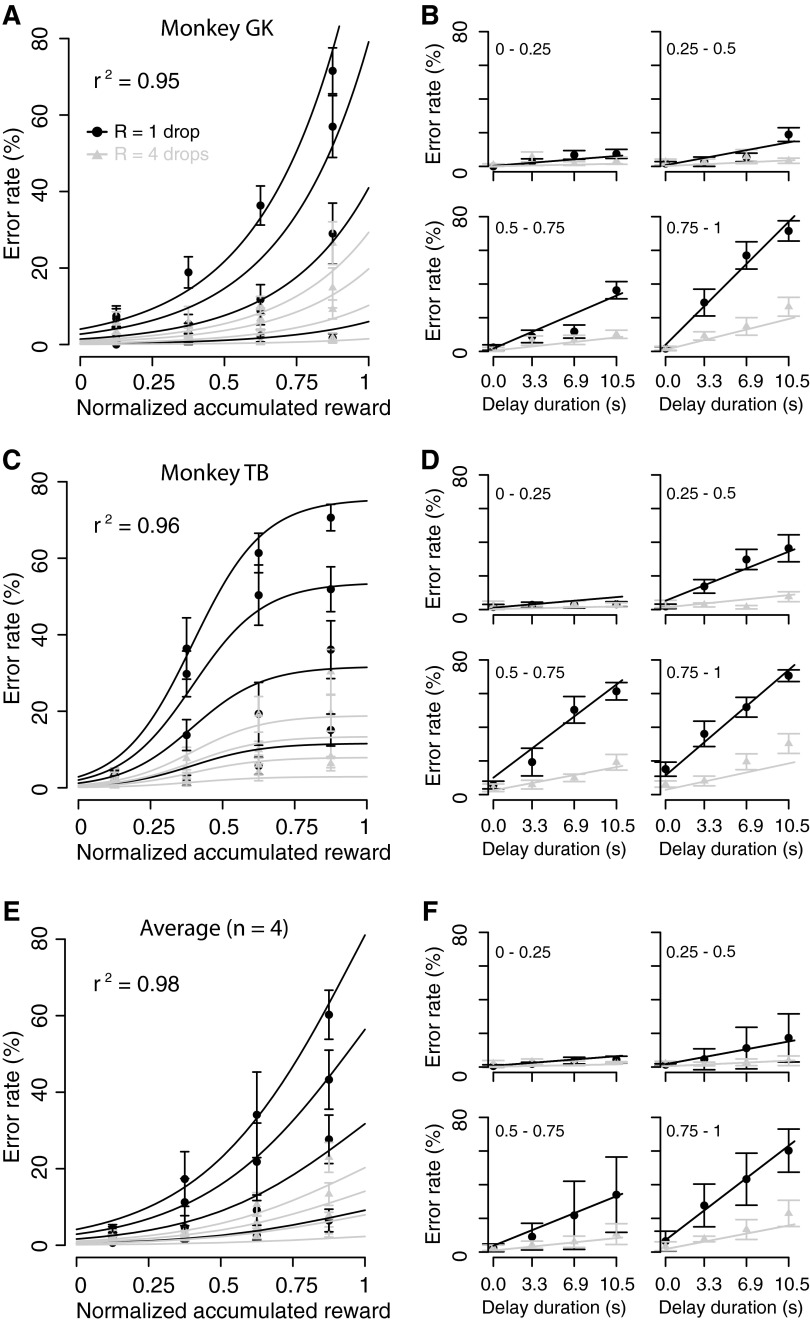
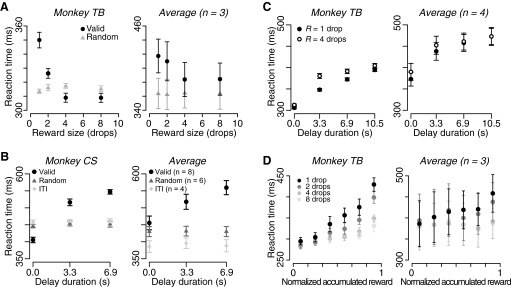
Motivation is usually inferred from the likelihood or the intensity with which behavior is carried out. It is sensitive to external factors (e.g., the identity, amount, and timing of a rewarding outcome) and internal factors (e.g., hunger or thirst). We trained macaque monkeys to perform a nonchoice instrumental task (a sequential red-green color discrimination) while manipulating two external factors: reward size and delay-to-reward. We also inferred the state of one internal factor, level of satiation, by monitoring the accumulated reward. A visual cue indicated the forthcoming reward size and delay-to-reward in each trial. The fraction of trials completed correctly by the monkeys increased linearly with reward size and was hyperbolically discounted by delay-to-reward duration, relations that are similar to those found in free operant and choice tasks. The fraction of correct trials also decreased progressively as a function of the satiation level. Similar (albeit noiser) relations were obtained for reaction times. The combined effect of reward size, delay-to-reward, and satiation level on the proportion of correct trials is well described as a multiplication of the effects of the single factors when each factor is examined alone. These results provide a quantitative account of the interaction of external and internal factors on instrumental behavior, and allow us to extend the concept of subjective value of a rewarding outcome, usually confined to external factors, to account also for slow changes in the internal drive of the subject.


Figures

FIG. 1.
FIG. 1.
Behavioral task and cue-outcome contingencies. A: sequence of events in the visually triggered bar-release task with incentive cue. The monkey initiates each trial by touching a lever. The monkey is required to respond by releasing the lever when the color of a visual target changed from red to green. A trial is scored as correct if the monkey releases the lever 200-1,000 ms after the target changes to green (Go). If the trial is correctly performed, a blue spot replaces the green target. Water reward is delivered after a delay period. A visual cue presented at the beginning of the trial indicates the duration of the delay or the reward size. B–E: relationship between cue and outcome (size and timing of the reward). B: the 4 cues used in the reward-size task. C: the 3 cues used in the reward-delay task. D: the 3 cues used in the next-trial-delay task. E: the 8 cues used in the reward-size-and-delay task.
FIG. 2.
FIG. 2.
Effect of expected reward size on error rate. Percentage of error trials (mean ± SE) as a function of reward size in (A) monkey TB and (B) in the average across 3 monkeys in the reward-size task. Black circles and gray triangles indicate valid (predictable) and random (unpredictable) conditions, respectively. The black curve is the best fit of Eq. 1 to the data collected in the valid cue condition.
FIG. 3.
FIG. 3.
Effect of predicted delay-to-reward on error rate. Percentage of error trials (mean ± SE) as a function of delay duration in (A) monkey CS and (B) in the average across monkeys in the reward-delay task. Black circles, gray triangles, and light gray diamonds indicate valid cue condition, random cue condition, and the next-trial delay task, respectively. The black lines are the regression lines [E = k × delay + constant; (A) k = 4.9 and (B) 4.5 (ranging from 1.8 to 6.6 in 8 monkeys); the r2 values are reported in the plots.] Number in parentheses represents the number of subjects.
FIG. 4.
FIG. 4.
Effect of predicted reward size and delay-to-reward on error rate. Percentage of error trials (mean ± SE) as a function of delay duration in (A) monkey TB and (B) in the average across 4 monkeys in the reward-size-and-delay task. Filled and open circles correspond to 1 and 4 drops of reward, respectively. Full black lines and dashed gray curves are the best fit of Eqs. 2 and 3, respectively.
FIG. 5.
FIG. 5.
Effect of normalized accumulated reward on error rate. Percentages of error trials (mean ± SE) for each reward size as a function of normalized accumulated reward in the reward-size task are shown for (A–C) 3 monkeys and (D) for the average across the monkeys. The superimposed curves are the best fit of Eq. 6 to the data in each reward size condition.
FIG. 6.
FIG. 6.
Effect of relationship among predicted reward size, delay-to-reward, and normalized accumulated reward on error rate. A: percentage of error trials (mean ± SE) for each incentive condition as a function of normalized accumulated reward (A, C, and E) and as a function of delay duration for each quartile of normalized accumulated reward (B, D, and E, from top left to bottom right) in (A and B) monkey GK, (C and D) monkey TB, and (E and F) in the average across 4 monkeys. Black and gray circles correspond to 1 and 4 drops of reward, respectively. Black and gray curves and lines are the best fit of Eq. 7 to the data collected with 1 and 4 drops of reward, respectively.
FIG. 7.
FIG. 7.
Effects of predicted reward size, delay, and normalized accumulated reward on reaction time. A: reaction time (mean ± SE) as a function of predicted reward size (left) in monkey TB and (right) in the average across 3 monkeys. B: reaction time (mean ± SE) as a function of delay duration (left) in monkey CS and (right) in the average across monkeys. Black circles, gray triangles, and light gray diamonds indicate valid cue condition, random cue condition, and the next-trial delay task, respectively. Number in parentheses represents the number of subjects. C: reaction time (mean ± SE) as a function of delay duration for each reward size (filled and open circles for 1 and 4 drops, respectively) (left) in monkey TB and (right) in average across 4 monkeys. D: reaction time (mean ± SE) for each predicted reward size as a function of normalized accumulated reward (left) in monkey TB and (right) in average across 3 monkeys.

References

    1. Bowman EM, Aigner TG, Richmond BJ. Neural signals in the monkey ventral striatum related to motivation for juice and cocaine rewards. J Neurophysiol 75: 1061–1073, 1996. - PubMed
    1. Chudasama Y, Wright KS, Murray EA. Hippocampal lesions in rhesus monkeys disrupt emotional responses but not reinforcer devaluation effects. Biol Psychiatry 63: 1084–1091, 2008. - PubMed
    1. Critchley HD, Rolls ET. Hunger and satiety modify the responses of olfactory and visual neurons in the primate orbitofrontal cortex. J Neurophysiol 75: 1673–1686, 1996. - PubMed
    1. Cromwell HC, Schultz W. Effects of expectations for different reward magnitudes on neuronal activity in primate striatum. J Neurophysiol 89: 2823–2838, 2003. - PubMed
    1. Gibbs J, Maddison SP, Rolls ET. Satiety role of the small intestine examined in sham-feeding rhesus monkeys. J Comp Physiol Psychol 95: 1003–1015, 1981. - PubMed

Publication types

LinkOut - more resources