. 2008 Nov 5;28(45):11622-34.
doi: 10.1523/JNEUROSCI.3153-08.2008.

Retinoic acid attenuates beta-amyloid deposition and rescues memory deficits in an Alzheimer's disease transgenic mouse model

Affiliations

Retinoic acid attenuates beta-amyloid deposition and rescues memory deficits in an Alzheimer's disease transgenic mouse model

Yun Ding et al. J Neurosci. .

Abstract

Recent studies have revealed that disruption of vitamin A signaling observed in Alzheimer's disease (AD) leads to beta-amyloid (Abeta) accumulation and memory deficits in rodents. The aim of the present study was to evaluate the therapeutic effect of all-trans retinoic acid (ATRA), an active metabolite of vitamin A, on the neuropathology and deficits of spatial learning and memory in amyloid precursor protein (APP) and presenilin 1 (PS1) double-transgenic mice, a well established AD mouse model. Here we report a robust decrease in brain Abeta deposition and tau phosphorylation in the blinded study of APP/PS1 transgenic mice treated intraperitoneally for 8 weeks with ATRA (20 mg/kg, three times weekly, initiated when the mice were 5 months old). This was accompanied by a significant decrease in the APP phosphorylation and processing. The activity of cyclin-dependent kinase 5, a major kinase involved in both APP and tau phosphorylation, was markedly downregulated by ATRA treatment. The ATRA-treated APP/PS1 mice showed decreased activation of microglia and astrocytes, attenuated neuronal degeneration, and improved spatial learning and memory compared with the vehicle-treated APP/PS1 mice. These results support ATRA as an effective therapeutic agent for the prevention and treatment of AD.


Figures
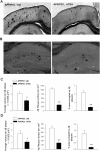
Figure 1.
Figure 1.
ATRA-treated APP/PS1 mice exhibit reduced levels of Aβ deposits compared with vehicle-treated (Veh) APP/PS1 mice. A, B, Representative images of Campbell-Switzer staining in frontal cortex (A) and hippocampus (B) in APP/PS1 mice treated with vehicle as control (left) or ATRA (right). Scale bars, 200 μm. C, D, Stereological quantification of Aβ volume (left), number (middle), and area occupied by Aβ plaques (right) in frontal cortex (C) and hippocampus (D) as described in Materials and Methods. Values from multiple images of each section that cover most to all the region of study were averaged per animal per experiment. Data are mean ± SEM from six mice per genotype. *p < 0.05, **p < 0.01 versus vehicle-treated control APP/PS1 mice.
Figure 2.
Figure 2.
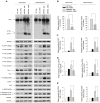
ATRA treatment decreased the production of APP–CTFs, phosphorylation of APP and Tau, and expression of CDK5 in APP/PS1 mice. A, Representative Western blots of APP, APP–CTFs, BACE1, phosphorylated APP (Thr668), phosphorylated Tau at Ser519, Ser202, Ser235, Ser396, and Ser404, tau-1, total tau, phosphorylated CDK5 (Ser159), p35, CDK5, phosphorylated GSK3β (Ser9), phosphorylated GSK3α,β (Tyr216), and GSK3β in cortical and hippocampal lysates of wild-type or APP/PS1 mice treated with vehicle and ATRA, respectively. B–E, Quantitative analysis of APP–CTFs (B), phosphorylated tau (D), phosphorylated APP (C), and CDK5 (E) from wild-type or APP/PS1 mice treated with vehicle (Veh) or ATRA. In all experiments, quantified results were normalized to β-actin expression. Values are expressed as percentages or folds of the values from the vehicle-treated APP/PS1 mice (set to 100%) and are the mean ± SEM (n = 6 animals of each group). *p < 0.05; **p < 0.01.
Figure 3.
Figure 3.
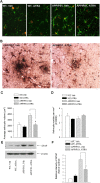
ATRA treatment results in a decrease in astrocytic reactivity in the brains of APP/PS1 mice. A, Fluorescent GFAP (green)/hnRNP-U (red) colocalization in the hippocampal CA3 region of APP/PS1 mice and wild-type mice (WT) treated with vehicle (Veh) or ATRA. Scale bar, 20 μm. B, Double staining of GFAP and Aβ plaques (Campbell-Switzer staining) showed less activated astrocytes surrounding the Aβ plaques in the hippocampal CA3 region of the ATRA-treated APP/PS1 mice (right) than that of the vehicle-treated control APP/PS1 mice (left). Scale bar, 20 μm. C, Quantification of astrocyte volume in the hippocampus by unbiased stereology. Mean value of each animal per group is the average of values from two to three experiments (total of 3–6 sections). Error bars represent means ± SEM from six mice per group. D, Quantification of astrocyte number in the hippocampus by unbiased stereology. Mean value of each animal per group is the average of values from two to three experiments (total of 3–6 sections). Error bars represent group means ± SEM from six mice per group. E, Representative Western blot of GFAP and β-actin in brain lysates of wild-type and APP/PS1 mice treated with vehicle or ATRA. F, Densitometric quantification of GFAP protein levels of wild-type and APP/PS1 mice treated with vehicle or ATRA (n = 3 per group). Values were expressed relative to control (wild-type mice treated with vehicle). Error bars represent means ± SEM of three mice per group. *p < 0.05 versus vehicle-treated control APP/PS1 mice.
Figure 4.
Figure 4.
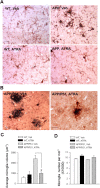
ATRA treatment results in a decrease in microglial reactivity in the brains of APP/PS1 mice. A, Representative immunostaining of Iba-I in the hippocampal CA3 region of APP/PS1 mice and wild-type mice (WT) treated with vehicle or ATRA. Scale bar, 20 μm. B, Double staining of Iba-I and Aβ plaques (Campbell-Switzer staining) showing less activated microglia surrounding the Aβ plaques in the hippocampal CA3 region of ATRA-treated (right) than the vehicle-treated (left) control APP/PS1 mice. Scale bar, 20 μm. C, Quantification of microglia volume in the hippocampus by unbiased stereology. Mean value of each animal per group is the average of values from two to three experiments (total of 3–6 sections). Error bars represent means ± SEM from six mice per group. D, Quantification of microglia number in the hippocampus by unbiased stereology. Mean value of each animal per group is the average of values from two to three experiments (total of 3–6 sections). Error bars represent means ± SEM from six mice per group. *p < 0.05 versus vehicle-treated control APP/PS1 mice.
Figure 5.
Figure 5.
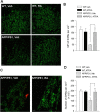
ATRA treatment prevents loss of presynaptic terminals in the brains of APP/PS1 mice. A, Fluorescent SYN immunostaining in the hippocampal CA3 region of APP/PS1 mice and wild-type mice (WT) treated with vehicle (Veh) or ATRA. Scale bar, 20 μm. B, Quantification of SYN immunoreactivity in the hippocampus. Mean value of each animal per group is the average of values from two to three experiments (total of 3–6 sections). Error bars represent means ± SEM from six mice per group. C, Double immunostaining of SYN (green) and Aβ plaques (red) showed loss of SIPBs surrounding the Aβ plaques in the hippocampal dentate gyrus of the vehicle-treated APP/PS1 mice (left). In contrast, the ATRA-treated APP/PS1 mice (right) showed more significant integrity of SIPBs in the hippocampal dentate gyrus in which no plaques were observed (right). Scale bar, 20 μm. D, Quantification of SIPB number in the hippocampus by unbiased stereology. Mean value of each animal per group is the average of values from two to three experiments (total of 3–6 sections). Error bars represent means ± SEM from six mice per group. *p < 0.05 versus vehicle-treated control APP/PS1 mice.
Figure 6.
Figure 6.
ATRA treatment prevents loss of MAP2 immunoreactivity in the brains of APP/PS1 mice. A, Fluorescent MAP2 immunostaining in the hippocampal CA1 region of APP/PS1 mice and wild-type mice (WT) treated with vehicle (Veh) or ATRA. Scale bar, 20 μm. B, Quantification of MFI of MAP2 immunoreactivity in the hippocampus. Mean value of each animal per group is the average of values from two to three experiments (total of 3–6 sections). Error bars represent means ± SEM from six mice per group. C, Double staining of MAP2 and Aβ plaques (Campbell-Switzer staining) showing more significant integrity of neuronal fibers surrounding the Aβ plaques in the frontal cortex of ATRA-treated APP/PS1 mice than in vehicle-treated control APP/PS1 mice. Scale bar, 20 μm. D, Quantification of neuronal volume in the hippocampus by unbiased stereology. Mean value of each animal per group is the average of values from two to three experiments (total of 3–6 sections). Error bars represent means ± SEM from six mice per group. E, Quantification of neuronal number in the hippocampus by unbiased stereology. Mean value of each animal per group is the average of values from two to three experiments (total of 3–6 sections). Error bars represent group means ± SEM from six mice per group. *p < 0.05 versus vehicle-treated control APP/PS1 mice.
Figure 7.
Figure 7.
Chronic ATRA treatment of APP/PS1 mice results in attenuation of AD-type spatial memory deterioration. A, Acquisition of spatial learning in the Morris water maze hidden-platform task. Learning deficits in the control vehicle (Veh)-treated control APP/PS1 mice were ameliorated in the ATRA-treated APP/PS1 mice. Latency score represents time taken to escape to the platform from the water. Lines represent mean ± SEM from six to eight mice (indicated) per group. B, Memory test in Morris water maze probe trial without platform. Note that the deficits in the vehicle-treated APP/PS1 mice were improved in the ATRA-treated APP/PS1 mice. Error bars represent mean ± SEM from six to eight mice (indicated) per group. *p < 0.05, **p < 0.01 versus vehicle-treated control APP/PS1 mice. WT, Wild type.

References

    1. Anderton BH, Betts J, Blackstock WP, Brion JP, Chapman S, Connell J, Dayanandan R, Gallo JM, Gibb G, Hanger DP, Hutton M, Kardalinou E, Leroy K, Lovestone S, Mack T, Reynolds CH, Van Slegtenhorst M. Sites of phosphorylation in tau and factors affecting their regulation. Biochem Soc Symp. 2001;73 - PubMed
    1. Apelt J, Schliebs R. Beta-amyloid-induced glial expression of both pro- and anti-inflammatory cytokines in cerebral cortex of aged transgenic Tg2576 mice with Alzheimer plaque pathology. Brain Res. 2001;894:21–30. - PubMed
    1. Aplin AE, Gibb GM, Jacobsen JS, Gallo JM, Anderton BH. In vitro phosphorylation of the cytoplasmic domain of the amyloid precursor protein by glycogen synthase kinase-3beta. J Neurochem. 1996;67:699–707. - PubMed
    1. Berse B, Blusztajn JK. Coordinated up-regulation of choline acetyltransferase and vesicular acetylcholine transporter gene expression by the retinoic acid receptor alpha, cAMP, and leukemia inhibitory factor/ciliary neurotrophic factor signaling pathways in a murine septal cell line. J Biol Chem. 1995;270:22101–22104. - PubMed
    1. Blanchard V, Moussaoui S, Czech C, Touchet N, Bonici B, Planche M, Canton T, Jedidi I, Gohin M, Wirths O, Bayer TA, Langui D, Duyckaerts C, Tremp G, Pradier L. Time sequence of maturation of dystrophic neurites associated with Abeta deposits in APP/PS1 transgenic mice. Exp Neurol. 2003;184:247–263. - PubMed

Publication types

MeSH terms