

Role of body fat distribution and the metabolic complications of obesity
- PMID: 18987271
- PMCID: PMC2585758
- DOI: 10.1210/jc.2008-1585
Role of body fat distribution and the metabolic complications of obesity
Abstract
Context: An upper body/visceral fat distribution in obesity is closely linked with metabolic complications, whereas increased lower body fat is independently predictive of reduced cardiovascular risk.
Evidence acquisition: The measured functions of different fat depots with regards to fatty acid storage and release in health and obesity were reviewed. The adverse effects of experimentally increasing free fatty acid (FFA) concentrations on liver, muscle, pancreatic beta-cell, and endothelial function were noted.
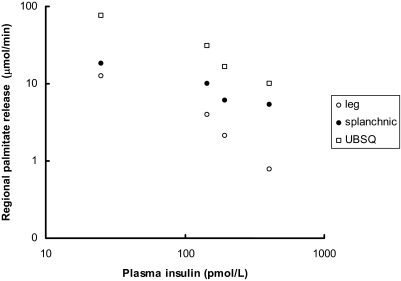
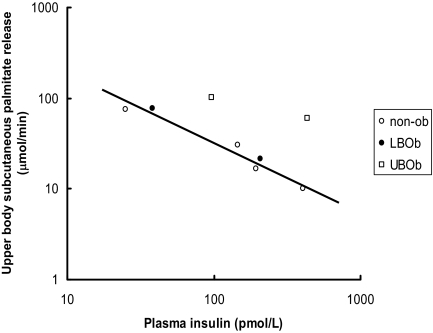
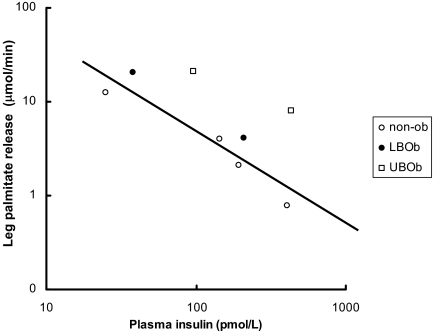
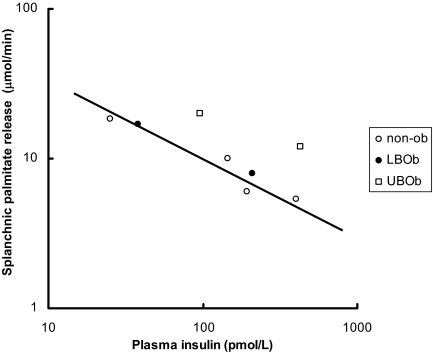
Evidence synthesis: The most dramatic abnormality in FFA metabolism is failure to suppress FFA concentrations/adipose tissue lipolysis normally in response to postprandial hyperinsulinemia. Upper body sc fat delivers the majority of FFA to the systemic circulation under postabsorptive and postprandial conditions. In upper body obesity, portal FFA concentrations resulting from both systemic and visceral adipose tissue lipolysis may be significantly greater than arterial FFA concentrations, exposing the liver to even greater amounts of FFA. Visceral fat also releases sufficient IL-6 to increase portal vein IL-6 concentrations, which can affect hepatic metabolism as well.
Conclusions: Lower body, upper body sc, and visceral fat depots have unique characteristics with regards to fatty acid metabolism. Selective dysregulation of these depots probably plays an important role with the metabolic complications of obesity.
Figures
References
-
- Wannamethee SG, Shaper AG, Whincup PH 2005 Alcohol and adiposity: effects of quantity and type of drink and time relation with meals. Int J Obes 29:1436–1444 - PubMed
-
- Canoy D, Wareham N, Luben R, Welch A, Bingham S, Day NK, Khaw KT 2005 Cigarette smoking and fat distribution in 21,828 British men and women: a population-based study. Obes Res 13:1466–1475 - PubMed
-
- Sachdev HS, Fall CH, Osmond C, Lakshmy R, Dey Biswas SK, Leary SD, Reddy KS, Barker DJ, Bhargava SK 2005 Anthropometric indicators of body composition in young adults: relation to size at birth and serial measurements of body mass index in childhood in the New Delhi birth cohort. Am J Clin Nutr 82:256–266 - PubMed
-
- Bouchard C, Despres JP, Mauriege P 1993 Genetic and nongenetic determinants of regional fat distribution. Endocr Rev 14:72–93 - PubMed
-
- Bouchard C, Tremblay A, Despres JP, Nadeau A, Lupien PJ, Theriault G, Dussault J, Moorjani S, Pinault S, Fournier G 1990 The response to long-term overfeeding in identical twins. N Engl J Med 322:1477–1482 - PubMed
Publication types
MeSH terms
Substances
Grants and funding
LinkOut - more resources
Full Text Sources
Other Literature Sources
Medical
