. 2009 Jan;37(1):50-63.
doi: 10.1007/s10439-008-9591-z. Epub 2008 Nov 6.

Hemodynamic performance of stage-2 univentricular reconstruction: Glenn vs. hemi-Fontan templates

Affiliations

Hemodynamic performance of stage-2 univentricular reconstruction: Glenn vs. hemi-Fontan templates

Kerem Pekkan et al. Ann Biomed Eng. 2009 Jan.

Abstract

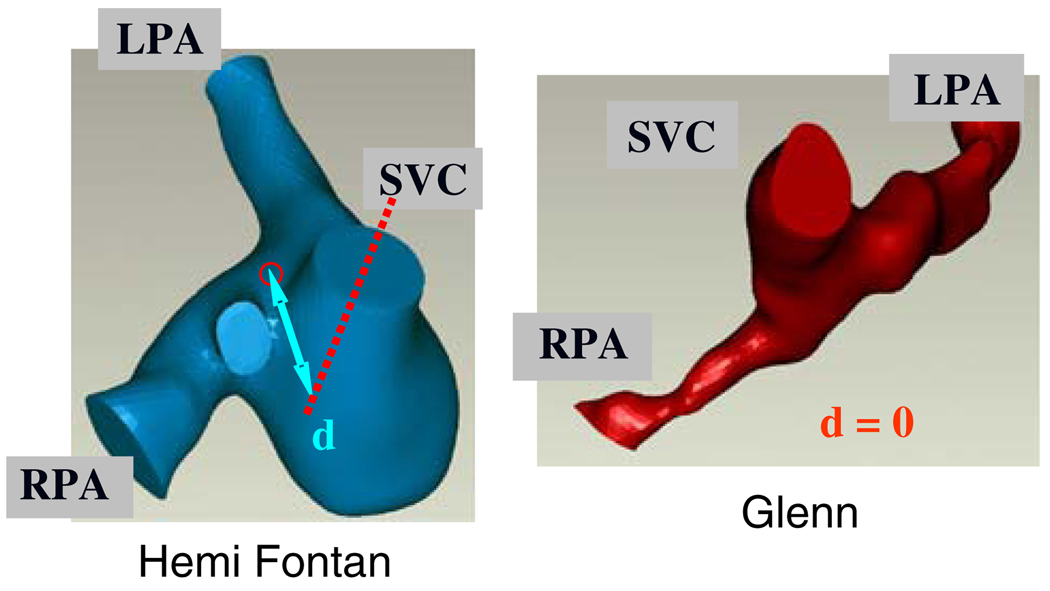
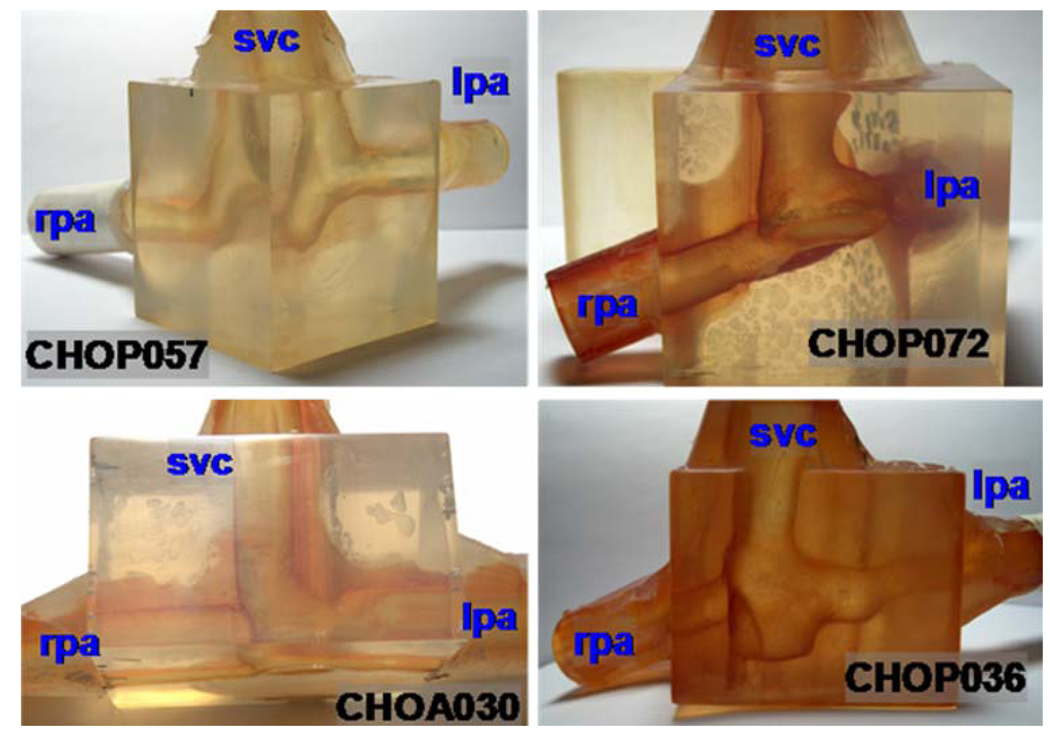
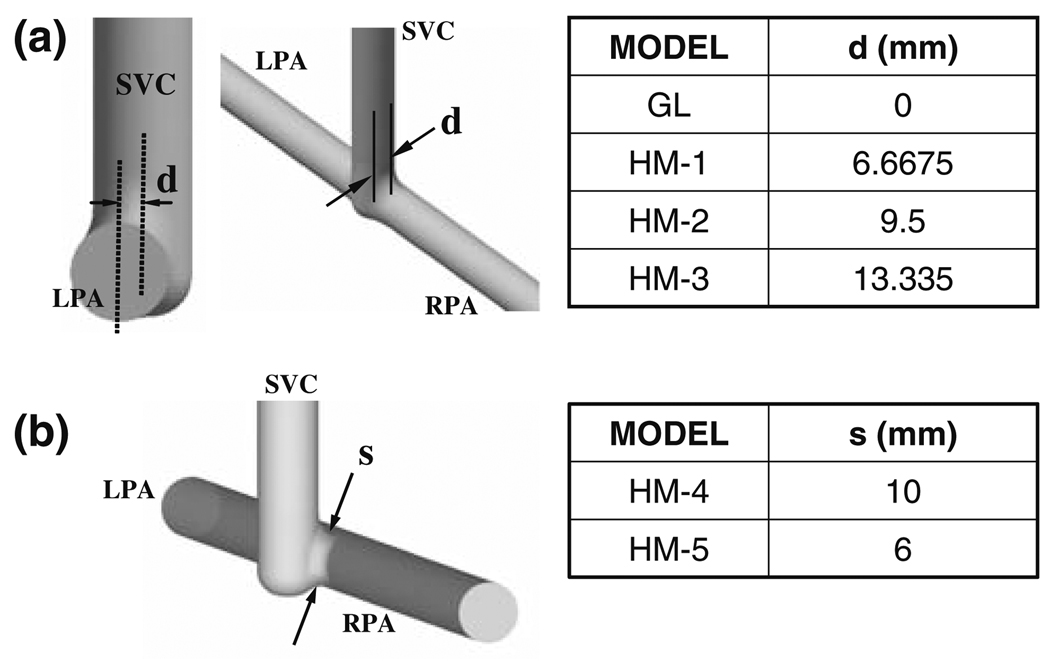
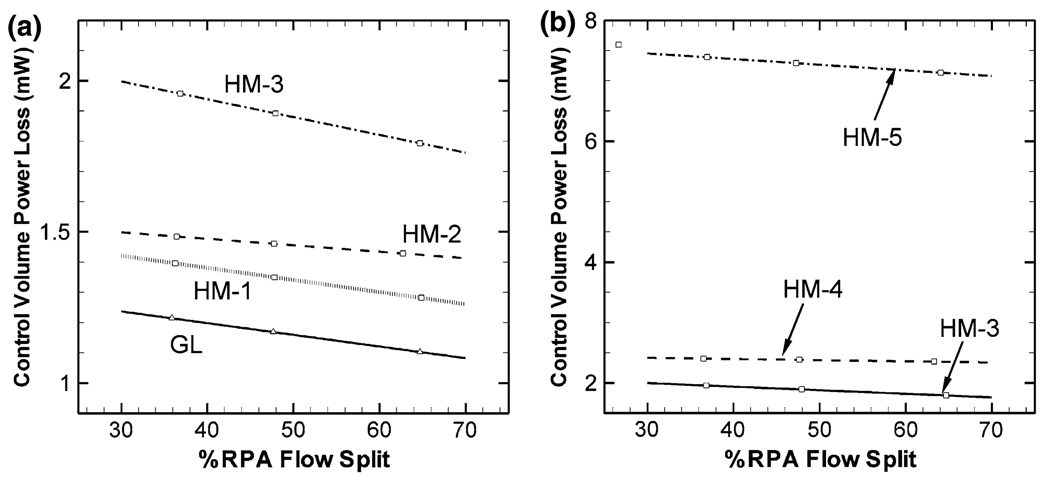
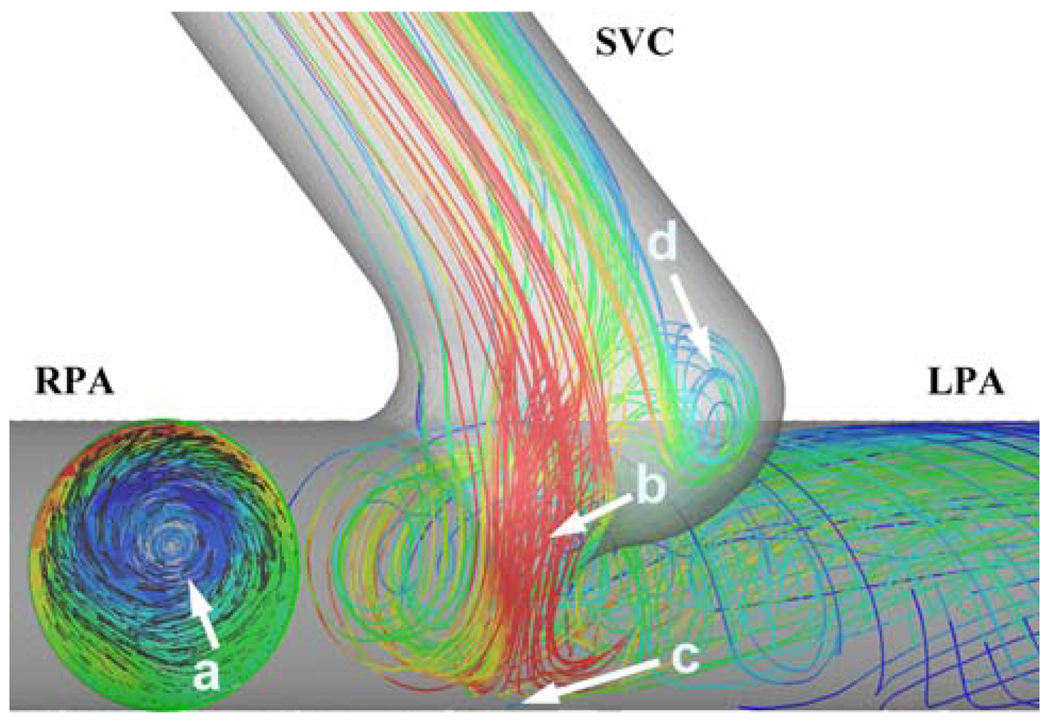
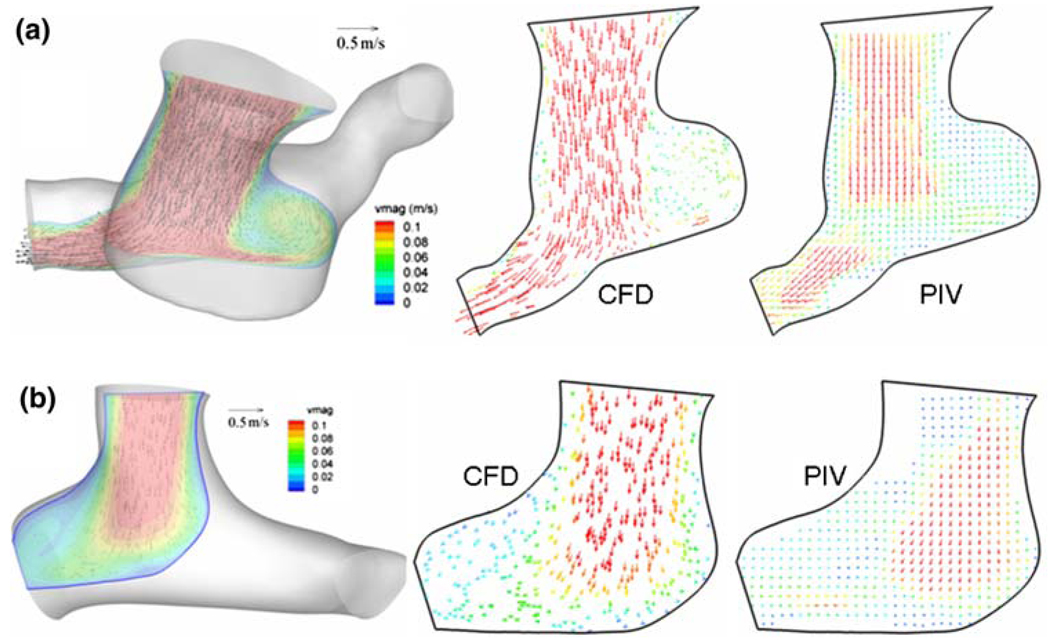
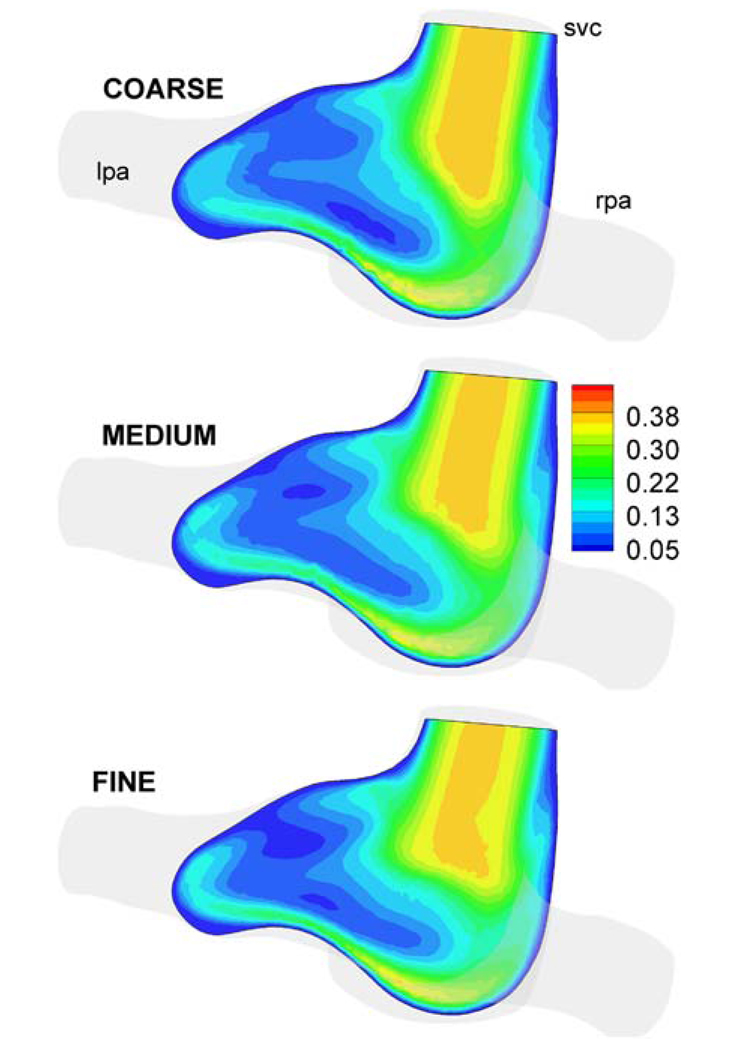
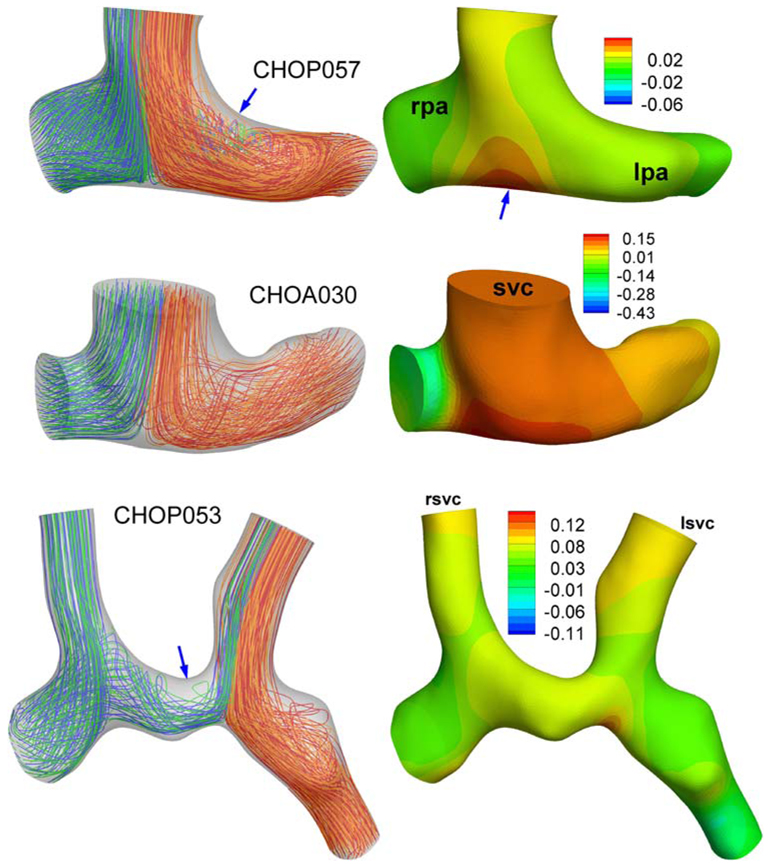
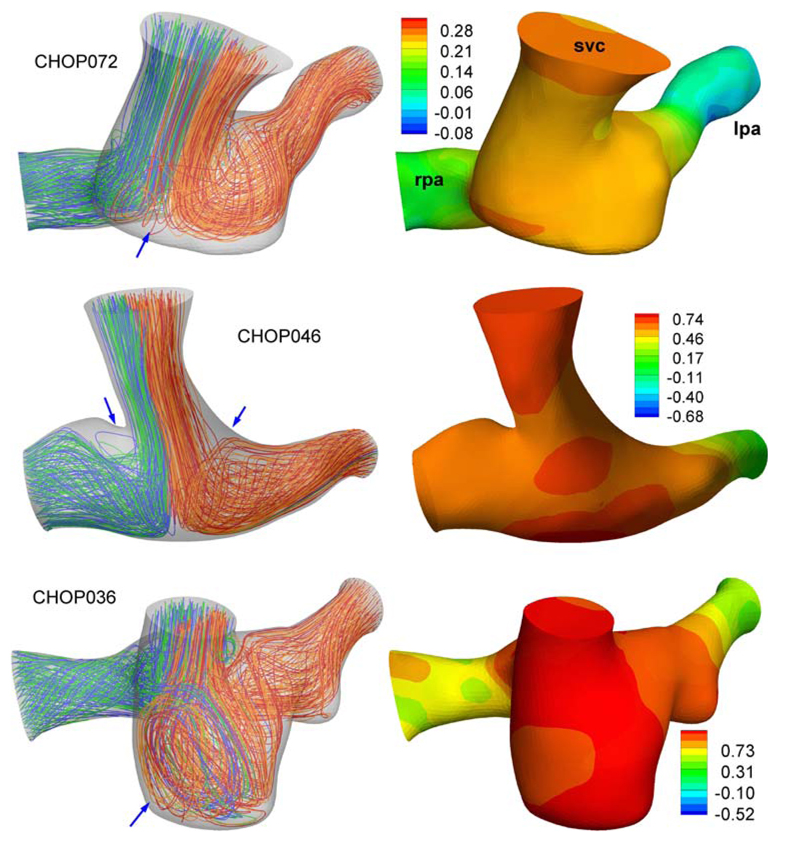
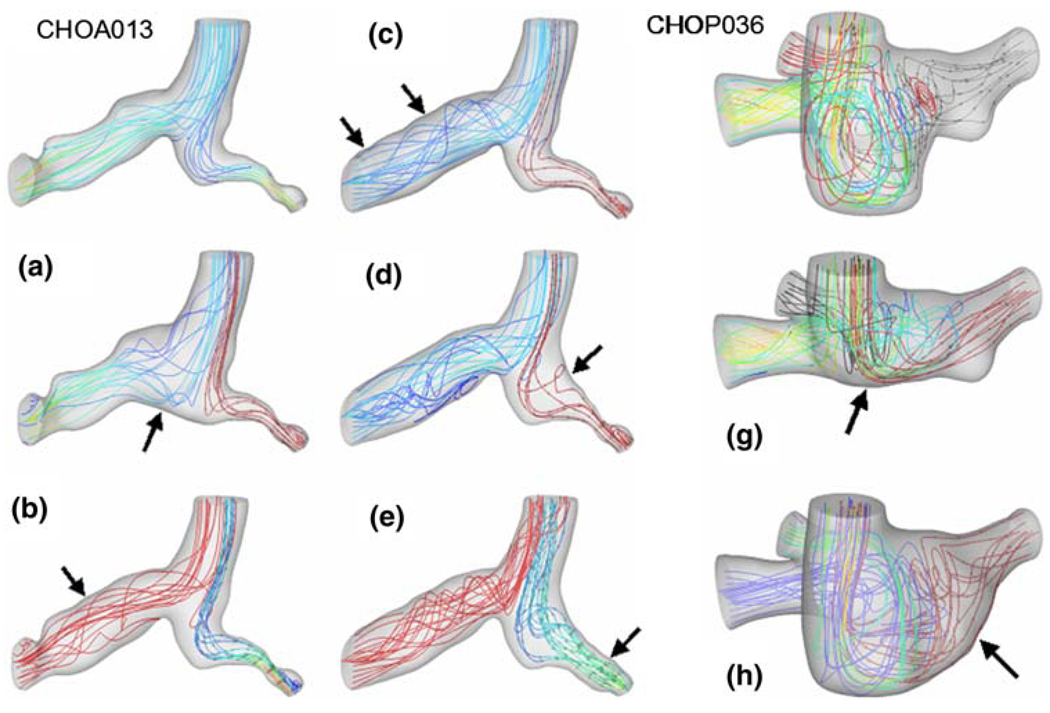
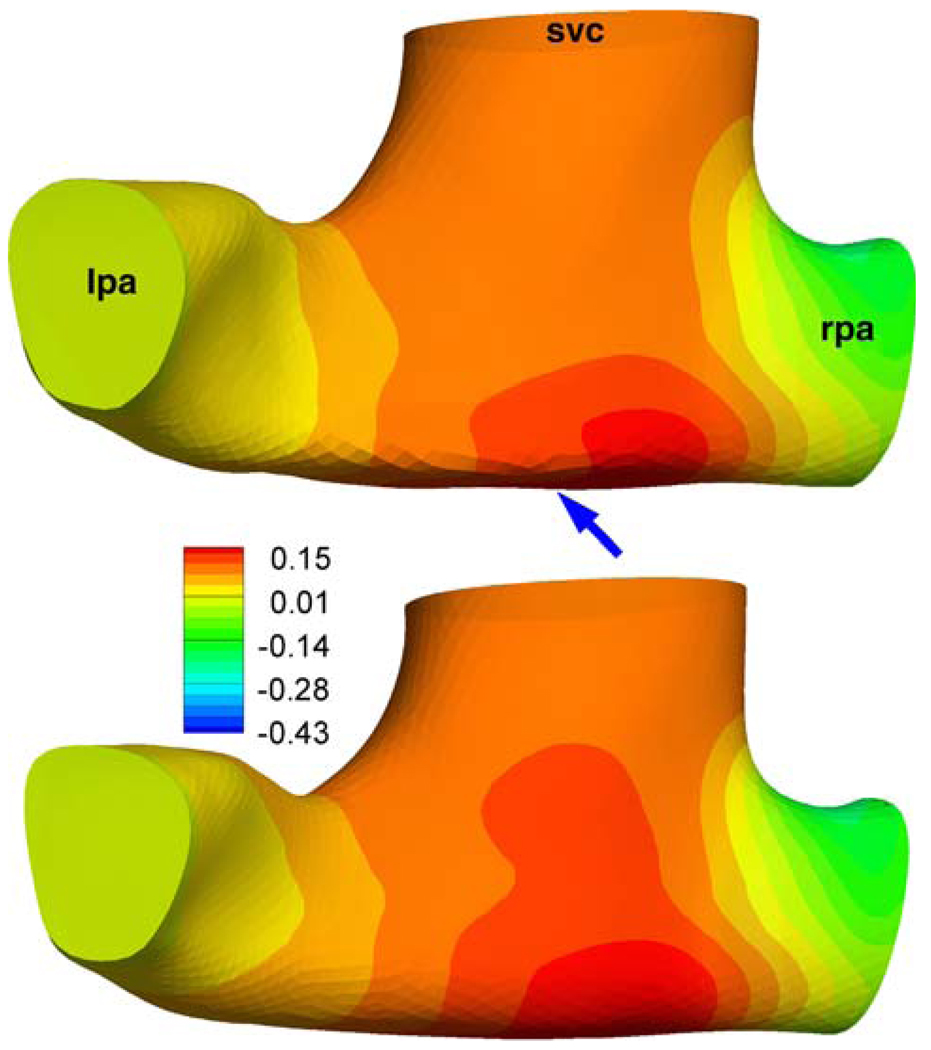
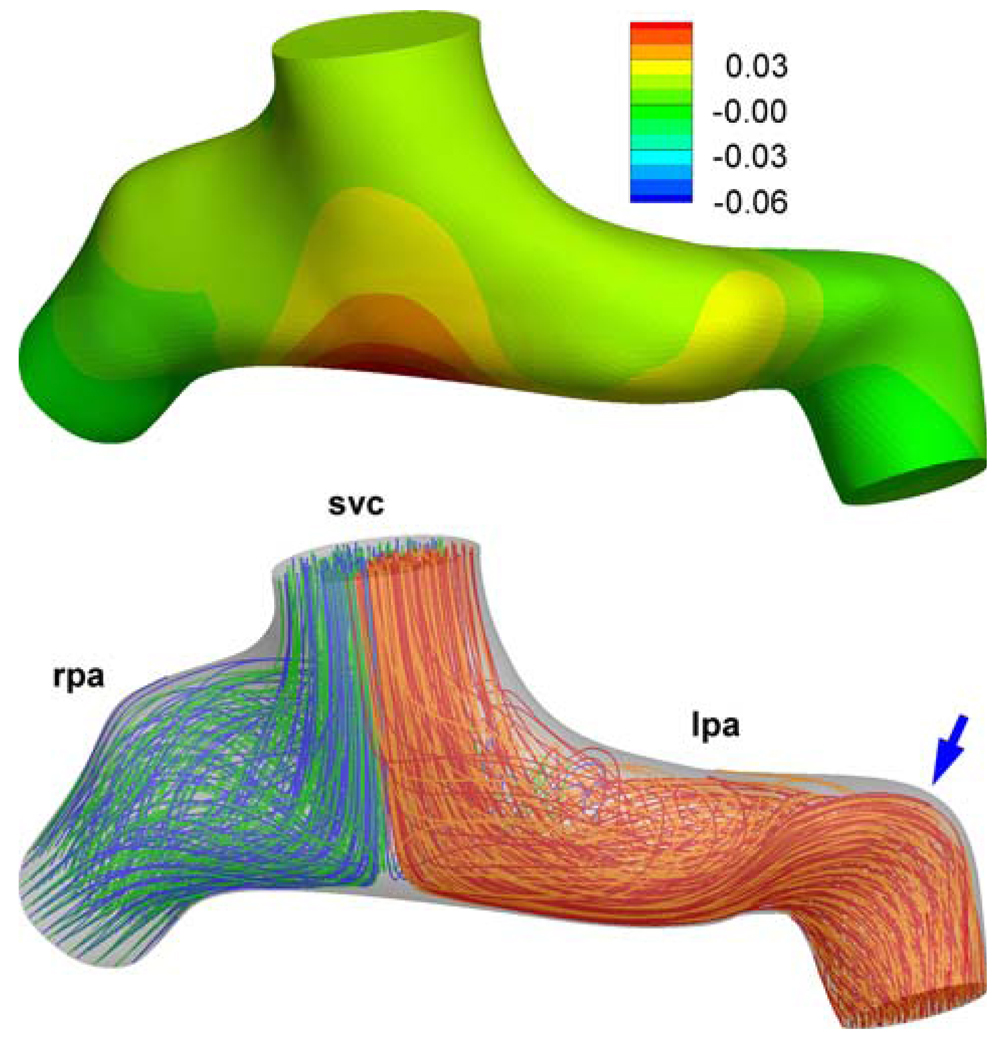
Flow structures, hemodynamics and the hydrodynamic surgical pathway resistances of the final stage functional single ventricle reconstruction, namely the total cavopulmonary connection (TCPC) anatomy, have been investigated extensively. However, the second stage surgical anatomy (i.e., bi-directional Glenn or hemi-Fontan template) has received little attention. We thus initiated a multi-faceted study, involving magnetic resonance imaging (MRI), phase contrast MRI, computational and experimental fluid dynamics methodologies, focused on the second stage of the procedure. Twenty three-dimensional computer and rapid prototype models of 2nd stage TCPC anatomies were created, including idealized parametric geometries (n = 6), patient-specific anatomies (n = 7), and their virtual surgery variant (n = 7). Results in patient-specific and idealized models showed that the Glenn connection template is hemodynamically more efficient with (83% p = 0.08 in patient-specific models and 66% in idealized models) lower power losses compared to hemi-Fontan template, respectively, due to its direct end-to-side anastomosis. Among the several secondary surgical geometrical features, stenosis at the SVC anastomosis or in pulmonary branches was found to be the most critical parameter in increasing the power loss. The pouch size and flare shape were found to be less significant. Compared to the third stage surgery the hydrodynamic resistance of the 2nd stage is considerably lower (both in idealized models and in anatomical models at MRI resting conditions) for both hemi- and Glenn templates. These results can impact the surgical design and planning of the staged TCPC reconstruction.


Figures

FIGURE 1
FIGURE 1
Typical three-dimensional patient-specific reconstructions of the hemi- and Glenn type S2R pathway templates. Superior caval offset distance is represented by d. LPA: Left pulmonary artery, RPA: Right pulmonary artery, SVC: Superior vena cava.
FIGURE 2
FIGURE 2
Photographs of the stereolithographic models used in particle image velocimetry experiments. Only 4 out of the 6 s stage patient-specific models that are analyzed are shown in this figure. Left column is Glenn template and Right column is hemi-Fontan.
FIGURE 3
FIGURE 3
Idealized 2nd stage models with the geometric dimensions and configurations studied in CFD. (a) Four models are created with varying SVC offset diameter, d as summarized in the Table. Case GL with d=0 mm approximate the Glenn configuration. Other three models correspond to hemi-Fontan with larger degree of SVC offset. In (b) variable SVC constriction (stenosis) is studied in two models which are created by reducing the SVC anastomosis pathway crosssectional area in HM-3. (HM-3 model feature the maximum possible superior caval anastomosis area).
FIGURE 4
FIGURE 4
Power loss characteristics of the idealized S2R models at different right pulmonary artery splits (% RPA). Superior vena cava (SVC) flow rate is 1.6 LPM for all models. Effect of SVC offset and SVC anastomosis narrowing is compared in (a) and (b), respectively.
FIGURE 5
FIGURE 5
Major flow structures in the idealized 2nd stage models. The CFD model is viewed from the inferior direction. (a) Flow swirl structure at the LPA (colors indicate through plane vorticity magnitude, red color: 89 s−1 red color: 247 s−1). (b) SVC jet through the anastomosis. (c) Stagnation region of the SVC jet. (d) Pouch vortex. Only the streamlines going to the left lung are plotted for better clarification of the flow structures. Colors of the streamlines correspond to velocity magnitude, red: high velocity (0.5 m s−1) and blue low velocity (0.03 m s−1).
FIGURE 6
FIGURE 6
CFD and PIV flow-fields along a typical section (registered on the 3D anatomy on the left) computed from CFD and measured using particle image velocimetry (PIV), (a) for the hemi-Fontan and (b) for the Glenn model.
FIGURE 7
FIGURE 7
Velocity magnitude (m s−1) in a typical section of the hemi-Fontan model (Database ID: CHOP036) for three different mesh refinements. COARSE: 133936, MEDIUM: 232036, and FINE: 330555 mesh sizes.
FIGURE 8
FIGURE 8
Flow streamlines (Left) and pressure distribution (Right) of Glenn models. SVC: Superior vena cava, LPA: Left pulmonary artery, RPA: Right pulmonary artery. Pressures are in mmHg and measured with respect to the LPA outlet. LPA streamlines are marked with alternating colors of blue-green and RPA streamlines are marked with orange-red. Blue arrows indicate major flow structures as discussed in section “Anatomical models—Flow structures and power loss”.
FIGURE 9
FIGURE 9
Flow streamlines (Left) and pressure distribution (Right) of hemi-Fontan models. SVC: Superior vena cava, LPA: Left pulmonary artery, RPA: Right pulmonary artery. Pressures are in mmHg and measured with respect to the LPA outlet. LPA streamlines are marked with alternating colors of blue-green and RPA streamlines are marked with orange-red. Blue arrows indicate major flow structures as discussed in section “Anatomical models—Flow structures and power loss”.
FIGURE 10
FIGURE 10
“Virtual” surgeries exploring the effects of anatomical features selectively. Left: Glenn model (NIH Database ID: CHOA013) where three PA stenosis are removed (Model C, B, and E), anastomosis is enlarged with a patch (Model A) and RPA flare added (Model E) to the original anatomy. Right: Three virtual modifications performed on the hemi-Fontan anatomy (NIH Database ID: CHOP036) where the pouch size is reduced (Model G) and LPA flare is added (Model H) to the original anatomy.
FIGURE A1
FIGURE A1
Effect of extra smoothing on the pressure distribution (mmHg) for a Glenn model (Database ID: CHOA030). Top: is the 3D reconstruction from the standard methodology (For the coronal view please refer to Fig. 8). Bottom: Over smoothed model, see arrow. No major differences were apparent in the streamline patterns of these two models.
FIGURE A2
FIGURE A2
Effect of distal PA morphology (arrow) on the computed flow fields and pressure drop (mmHg). For the model with a straight PA please refer to Fig. 8. (Database ID:Chop057).

References

    1. Azakie A, McCrindle BW, Van Arsdell G, Benson LN, Coles J, Hamilton R, Freedom RM, Williams WG. Extracardiac conduit versus lateral tunnel cavopulmonary connections at a single institution: impact on outcomes. J. Thorac. Cardiovasc. Surg. 2001;122(6):1219–1228. doi: 10.1067/mtc.2001.116947. - DOI - PubMed
    1. Bando K, Turrentine MW, Park HJ, Sharp TG, Scavo V, Brown JW. Evolution of the Fontan procedure in a single center. Ann. Thorac. Surg. 2000;69(1873–9) doi: 10.1016/S0003-4975(00)01316-3. - DOI - PubMed
    1. Bove EL, de Leval MR, Migliavacca F, Guadagni G, Dubini G. Computational fluid dynamics in the evaluation of hemodynamic performance of cavopulmonary connections after the Norwood procedure for hypoplastic left heart syndrome. J. Thorac. Cardiovasc. Surg. 2003;126(4):1040–1047. doi: 10.1016/S0022-5223(03)00698-6. - DOI - PubMed
    1. Cebral JR, Castro MA, Burgess JE, Pergolizzi RS, Sheridan MJ, Putman CM. Characterization of cerebral aneurysms for assessing risk of rupture by using patient-specific computational hemodynamics models. Am. J. Neuroradiol. 2005;26(10):2550–2559. - PMC - PubMed
    1. Dasi LP, Pekkan K, Whitehead K, Fogel M, Yoganathan AP. Hepatic blood flow distribution in the total cavopulmonary connection: patient-specific anatomical models. ASME 2007 Summer Bioengineering Conference (SBC2007), P. o. t. ASME; Keystone Resort & Conference Center; Keystone, Colorado. 2007. edited by.

Publication types