. 2009 Mar;150(3):1122-31.
doi: 10.1210/en.2008-1241. Epub 2008 Nov 6.

S-glutathionylation impairs signal transducer and activator of transcription 3 activation and signaling

Affiliations

S-glutathionylation impairs signal transducer and activator of transcription 3 activation and signaling

Yi Xie et al. Endocrinology. 2009 Mar.

Abstract

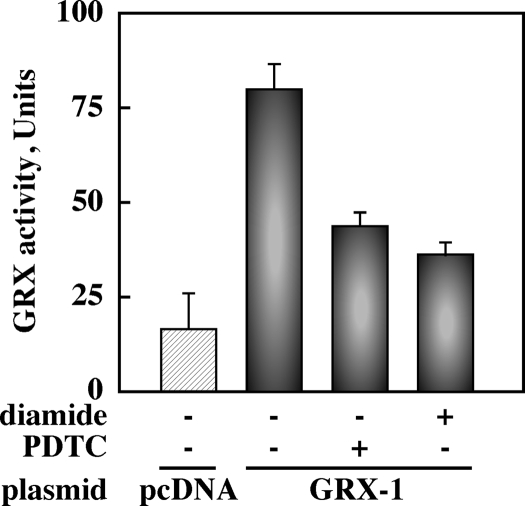
S-glutathionylation is a physiological, reversible protein modification of cysteine residues with glutathione in response to mild oxidative stress. Because the key cell growth regulator signal transducer and activator of transcription (STAT) 3 is particularly susceptible to redox regulation, we hypothesized that oxidative modification of cysteine residues of STAT3 by S-glutathionylation may occur. Herein, we show that the cysteine residues of STAT3 are modified by a thiol-alkylating agent and are the targets of S-glutathionylation. STAT3 protein thiol reactivity was reversibly attenuated with concomitant increase in the S-glutathionylation of STAT3 upon treatment of human HepG2 hepatoma cells with pyrrolidine dithiocarbamate, glutathione disulfide, or diamide. Under these conditions there was a marked reduction in IL-6-dependent STAT3 signaling, including decreased STAT3 tyrosine phosphorylation, loss in nuclear accumulation of STAT3, and impaired expression of target genes, such as fibrinogen-gamma. In a cell-free system, diamide induced glutathionylation of STAT3, which was decreased upon addition of glutaredoxin (GRX)-1, a deglutathionylation enzyme, or the reducing agent, dithiothreitol. Glutathionylated STAT3 was a poor Janus protein tyrosine kinase 2 substrate in vitro, and it exhibited low DNA-binding activity. Cellular GRX-1 activity was inhibited by diamide and pyrrolidine dithiocarbamate treatment; however, ectopic expression of GRX-1 was accompanied by a modest increase in phosphorylation, nuclear translocation, and DNA-binding ability of STAT3 in response to IL-6. These results are the first to show S-glutathionylation of STAT3, a modification that may exert regulatory function in STAT3 signaling.


Figures

Figure 1
Figure 1
Reversible reduction in IL-6-induced STAT3 signaling in response to mild oxidative stress. A, HepG2 cells were serum starved for 3–4 h and then left untreated or treated with PDTC (100 μm, 2 h) or diamide (500 μm, 30 min), followed by stimulation with IL-6 (20 ng/ml) for 20 min at 37 C. B, Cells were pretreated with diamide (500 μm) for 30 min, washed, and incubated with fresh medium for 0, 5, 15, and 45 min before the addition of IL-6 for 15 min. A and B, Cells were lysed and analyzed by Western blot with an antibody raised against pY-STAT3 (top panels). ERK1/2 was used as a loading control (lower panels). The OD of the pY-STAT3 band in untreated, IL-6-stimulated cells was arbitrarily given the value of 1.0. The numbers given under the different panels [relative units (Rel. Units)] represent the relative intensities of the protein bands from two independent experiments. The positions of pY-STAT3 and ERK1/2 are indicated on the left and that of the molecular mass markers (in kDa) are shown on the right. C, PDTC decreases nuclear translocation of STAT3 in HepG2 cells. Cells were preincubated with vehicle (veh.) or 50 μm PDTC for 2 h, then treated with 20 ng/ml IL-6 for 20 min. Cells were fixed and probed with STAT3 antibody to detect subcellular localization of STAT3. Nuclei were visualized by staining with Topro. Confocal images in the bottom panels are overlay of STAT3 and Topro images. The results are representative to three independent experiments. D, Effect of PDTC on FBG protein levels of HepG2 cells stimulated with IL-6. HepG2 cells were left untreated or treated with PDTC for 2 h before the addition of IL-6 (20 ng/ml) or IL-1β (20 ng/ml) for 24 h. Cells were lysed and analyzed by immunoblotting for expression of FBG (top panel), pY-STAT3 (middle panel), and ERK1/2 (lower panel) as a loading control. Similar results were obtained in two independent experiments.
Figure 2
Figure 2
STAT3 contains cysteine residues that are targets for oxidant-mediated S-glutathionylation. A and B, Serum-starved HepG2 cells were left untreated or incubated either with PDTC (50 μm, 2 h), GSH disulfide (GSSG, 20 mm, 30 min) or diamide (500 μm, 30 min), after which cells were homogeneized in RIPA buffer supplemented with the thiol biotinylating agent, MBB (200 μm), for 30 min on ice. A, After quenching the alkylation reaction with excess l-cysteine, the clarified cell lysates were subjected to immunoprecipitation with STAT3 antibody and immunoblotted with streptavidin-conjugated HRP (top panel) and STAT3 (lower panel) as a loading control. B, Alternatively, the clarified cell lysates were incubated with CaptAvidin-linked agarose for 1 h at 4 C, and the immobilized proteins were eluted with biotin, followed by Western blot analysis with anti-STAT3. The band intensity of thiol-biotinylated STAT3 in untreated cells was arbitrarily given the value of 1.0. Results are representative of two separate experiments with similar results. C, Reversible oxidation of STAT3 cysteine residues by PDTC. HepG2 cells were treated without or with PDTC for 2 h. Cell lysates were subjected to biotin switch assay, followed by affinity precipitation with streptavidin-agarose and then immunoblot analysis with anti-STAT3 antibody. Bands were detected only in PDTC-treated cells and when biotin-HPDP was included in the assay. D, HepG2 cells were left untreated or incubated with PDTC, GSSG, or diamide as indicated in A. STAT3 immunoprecipitates were separated by SDS-PAGE under nonreducing conditions, and analyzed by Western blot with a monoclonal antibody against protein-bound GSH (αSSG, top panel) and STAT3 (lower panel) as a loading control. The S-glutathionylated STAT3 band intensity in untreated cells was arbitrarily given the value of 1.0. Rel. Units, Relative units; veh, vehicle.
Figure 3
Figure 3
In vitro S-glutathionylation inhibits JAK2-mediated STAT3 phosphorylation and its DNA-binding activity. A, STAT3 is an in vitro target of glutathionylation/deglutathionylation reaction. Anti-STAT3 immunoprecipitates from control HepG2 cells were left untreated (lane 1) or treated with diamide (1 mm)/2 mm GSH for 1 h at room temperature (lanes 2–5), after which vehicle (veh.), recombinant E. coli GRX-1 or DTT was added for 30 min. The immune pellets were resolved by SDS-PAGE under nonreducing conditions, and analyzed by Western blot with antibodies raised against αSSG (top panel) and STAT3 as a loading control (bottom panel). B, STAT3 immunoprecipitates were left untreated or treated with 1 mm diamide/GSH as described under Materials and Methods. Tyrosine phosphorylation was then performed using recombinant active JAK2 for 10 min at 30 C. The proteins in the immune pellets were analyzed by Western blot using antibodies against pY-STAT3 (upper panel) and total STAT3 (lower panel). The reversibility of the inhibitory effect of diamide was shown by using 2 mm DTT before the JAK2-mediated phosphorylation step. The numbers given under the panel [relative units (Rel. Units)] represent the quantitated ratios of pY-STAT3 to total STAT3 relative to that of untreated vehicle control. Results are representative of two independent experiments. C, Cells were treated in the absence or the presence of IL-6 (20 ng/ml) for 30 min. Nuclear extracts were prepared, and DNA binding activity of STAT3 was determined as described under Materials and Methods. Nuclear extracts were incubated with agarose-bound oligonucleotide probe containing the wild-type (wt) GAS consensus sequence (lanes 1–2) or the same probe mutated (mut) at the GAS site (lanes 3–4). Bound STAT3 was resolved by SDS-PAGE, and analyzed by Western blot with anti-pY-STAT3. An identical result was obtained in an additional experiment. D, The nuclear extracts of IL-6-stimulated cells were treated without or with 3 mm GSSG for 1 h at 37 C to induce in vitro S-glutathionylation. STAT3 immobilized with agarose-bound wild-type oligonucleotide probe was analyzed by Western blot using anti-pY-STAT3. The numbers given in the panel (Rel. Units) represent the intensities of pY-STAT3 protein bands relative to that of control IL-6-stimulated cells. Results are representative of four independent observations from two separate experiments with similar results.
Figure 4
Figure 4
GRX activity is reduced by oxidants. HepG2 cells transiently transfected with pcDNA vector (hatched bar) and GRX-1 plasmid (filled bars) were left untreated or incubated with PDTC (50 μm, 2 h) or diamide (500 μm, 30 min). GRX activity was measured in cell lysates as described in Materials and Methods. Bars are means ± sd of a single experiment performed in triplicate. Results are representative of two separate experiments with similar results.
Figure 5
Figure 5
Ectopic expression of GRX-1 enhances IL-6-induced STAT3 signaling. Cells were transiently transfected with Flag-STAT3 together with pcDNA vector or GRX-1 plasmid. A, Forty-eight hours later, cells were homogeneized in RIPA buffer containing MBB, and anti-Flag immunoprecipitates were analyzed by Western blot using HRP-conjugated streptavidin (Strep.) (top panel) or anti-STAT3 (second panel) and anti-GRX-1 (bottom panel) antibodies. B, Serum-starved transfected cells were left untreated or incubated with diamide (500 μm) for 30 min, followed by the addition of IL-6 (20 ng/ml) for 20 min. The anti-Flag immunoprecipitates were analyzed by Western blotting for the detection of pY-STAT3 (top panel), and Flag-STAT3 (second panel). Immunoblot analysis showed detection of GRX only in clarified lysates of GRX-1-transfected cells (third panel). Endogenous ERK 1/2 was detected at comparable levels in each lane (bottom panel). The pY-STAT3 band intensity in Flag-STAT3-transfected cells stimulated with IL-6 was arbitrarily given the value of 1.0. No pY-STAT3 signal was detected in the absence of IL-6 (data not shown). IP, Immunoprecipitation; IB, immunoblots. C, The levels of Flag-STAT3 in the nuclear (Nuc) (second panel) and cytosolic (Cyt) (third panel) fractions of serum-starved cells exposed to IL-6 (20 ng/ml) for 30 min were assessed by Western blot analysis. The membranes were reprobed with BRG-1 (top panel) and ERK 1/2 (bottom panel) antibodies to demonstrate equal protein loading in each lane. D, Nuclear Flag-STAT3 band intensities were normalized to cellular pool (nuclear + cytosolic) of Flag-STAT3 protein. The dot plot represents the individual measurements that were derived from two separate experiments, each performed in duplicate dishes. Rel. Units, Relative units; veh., vehicle.
Figure 6
Figure 6
Effect of GRX-1 overexpression on STAT3 DNA binding and induction of target genes. A, ChIP assays using agarose-conjugated Flag antibody (M2-Ag) were performed in HepG2 cells transfected with Flag-STAT3 plasmid together with empty vector (pcDNA) or GRX-1 plasmid, and then left untreated or stimulated with IL-6 for 30 min. The results are expressed as percentage of immunoprecipitated (IP) DNA to total DNA input (input). Similar results were obtained in three independent experiments. B, HepG2 cells were transiently cotransfected with pGAS-TA-Luc reporter plasmid, pCMVSport-β-galactosidase expression plasmid, and Flag-tagged STAT3 together with either pcDNA empty vector or GRX-1 plasmid. Twenty-four hours later, the cells were serum starved for 4 h and then pretreated with vehicle (veh.) (open bars) or 20 ng/ml IL-6 (filled bars) for 6 h. Cell extracts were analyzed for luciferase activity and normalized for β-galactosidase. All values are expressed relative to that of Flag-STAT3-expressing cells without IL-6. Results are expressed as means ± sd of a single experiment performed in triplicate dishes. Results are representative of two separate experiments with similar results.

Similar articles

Cited by

References

    1. Kishimoto T 2005 Interleukin-6: from basic science to medicine—40 years in immunology. Annu Rev Immunol 23:1–21 - PubMed
    1. Fu AK, Fu WY, Ng AK, Chien WW, Ng YP, Wang JH, Ip NY 2004 Cyclin-dependent kinase 5 phosphorylates signal transducer and activator of transcription 3 and regulates its transcriptional activity. Proc Natl Acad Sci USA 101:6728–6733 - PMC - PubMed
    1. Schuringa JJ, Schepers H, Vellenga E, Kruijer W 2001 Ser727-dependent transcriptional activation by association of p300 with STAT3 upon IL-6 stimulation. FEBS Lett 495:71–76 - PubMed
    1. Kortylewski M, Feld F, Krüger KD, Bahrenberg G, Roth RA, Joost HG, Heinrich PC, Behrmann I, Barthel A 2003 Akt modulates STAT3-mediated gene expression through a FKHR (FOXO1a)-dependent mechanism. J Biol Chem 278:5242–5249 - PubMed
    1. Lufei C, Koh TH, Uchida T, Cao X 2007 Pin1 is required for the Ser727 phosphorylation-dependent Stat3 activity. Oncogene 26:7656–7664 - PubMed

Publication types

MeSH terms