

Review
doi: 10.1126/science.1156409.
Genetic mapping in human disease
Affiliations
- PMID: 18988837
- PMCID: PMC2694957
- DOI: 10.1126/science.1156409
Item in Clipboard
Review
Genetic mapping in human disease
Science.
.
Abstract
Genetic mapping provides a powerful approach to identify genes and biological processes underlying any trait influenced by inheritance, including human diseases. We discuss the intellectual foundations of genetic mapping of Mendelian and complex traits in humans, examine lessons emerging from linkage analysis of Mendelian diseases and genome-wide association studies of common diseases, and discuss questions and challenges that lie ahead.
Figures
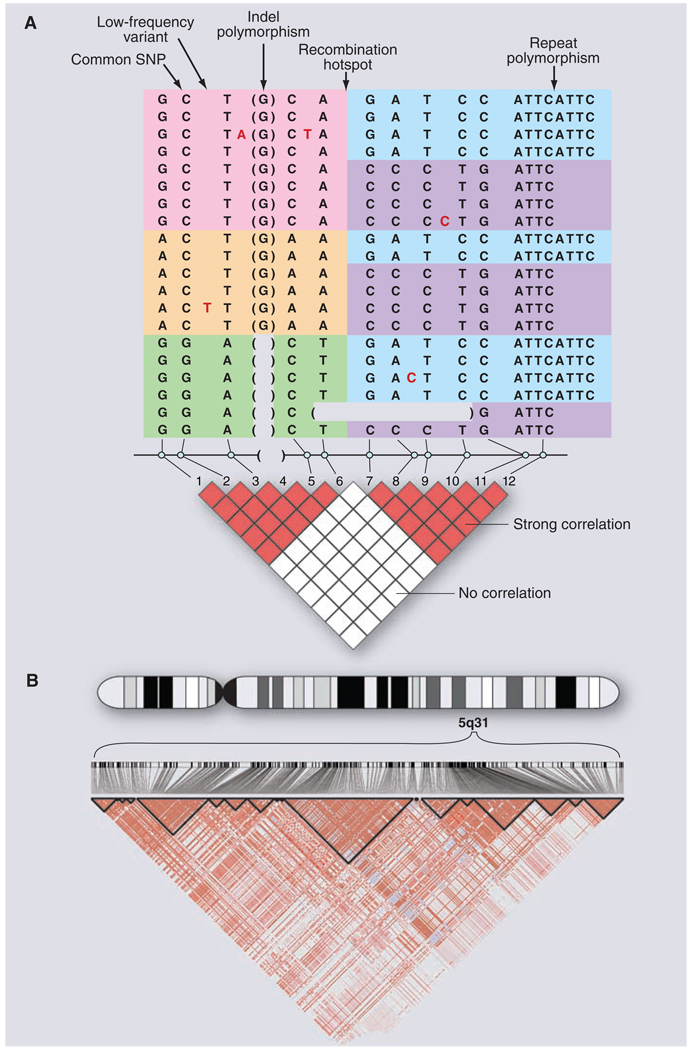
(A) Common and rare genetic variation in 10 individuals, carrying 20 distinct copies of the human genome. The amount of variation shown here is typical for a 5-kb stretch of genome and is centered on a strong recombination hotspot. The 12 common variations include 10 SNPs, an insertion-deletion polymorphism (indel), and a tetranucleotide repeat polymorphism. The six common polymorphisms on the left side are strongly correlated. Although these six polymorphisms could theoretically occur in 26 possible patterns, only three patterns are observed (indicated by pink, orange, and green). These patterns are called haplotypes. Similarly, the six common polymorphisms on the right side are strongly correlated and reside on only two haplotypes (indicated by blue and purple). The haplotypes occur because there has not been much genetic recombination between the sites. By contrast, there is little correlation between the two groups of polymorphisms, because a hotspot of genetic recombination lies between them. The pairwise correlation between the common sites is shown by the red and white boxes below, with red indicating strong correlation and white indicating weak correlation. In addition to the common polymorphisms, lower-frequency polymorphisms also occur in the human genome. Five rare SNPs are shown, with the variant nucleotide marked in red and the reference nucleotide not shown. In addition, on the second to last chromosome, a larger deletion variant is observed that removes several kilobases of DNA. Such larger deletion or duplication events (i.e., CNVs) may be common and segregate as other DNA variants. (B) Small regions such as in (A) are often embedded in genomic regions with much greater extents of LD. The diagram shows actual data from the International HapMap Project, showing 420 genetic variants in a region of 500 kb on human chromosome 5q31. Positions of the variants and the pairwise correlations are shown below. Blocks of strong correlation are indicated by the black outlines. Longer-range patterns are often more complex than shown in (A) because weaker recombination hotspots may reduce, but not completely eliminate, marker-to-marker correlation.
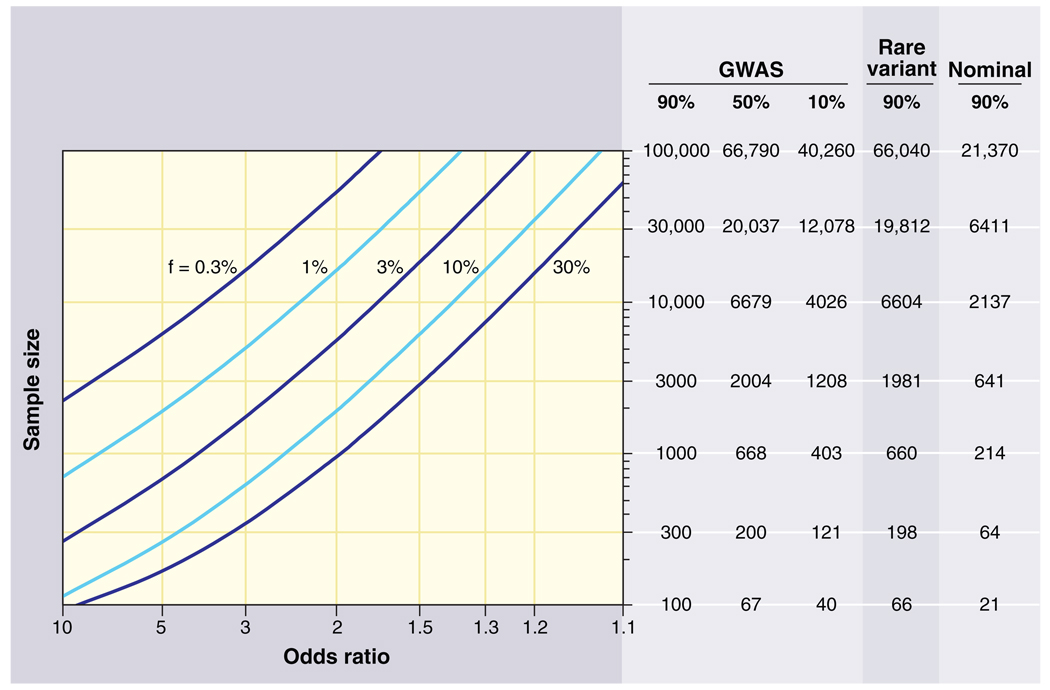
Sample sizes required for genetic association studies. The graphs show the total number N of samples (consisting of N/2 cases and N/2 controls) required to map a genetic variant as a function of the increased risk due to the disease-causing allele (x axis) and the frequency of the disease-causing allele (various curves). The required sample size is shown in the table on the right for various different kinds of association studies. The first three columns pertain to GWASs using common variants across the entire genome; the columns correspond to different levels of statistical power to achieve a significant result at P < 10−8. The fourth column pertains to a search for rare variants where the frequency listed is the collective frequency of rare variants in controls, and the odds ratio is the excess in cases as compared to controls. Sample sizes assume correction for a genome-wide search of ~20,000 protein-coding genes in the genome (aiming to achieve P < 10−5 with one test performed per gene). The fifth column pertains to a test of a single hypothesis (e.g., testing association with a single SNP). For example, in a GWAS, 1000 samples provide 90% statistical power to detect a 30% allele with a factor of 2 effect. In a genome-wide search via exon sequencing, 660 samples provide 90% power to detect a gene in which rare variants have aggregate population frequency 1% and convey a factor of ~8 increase in risk. Note that the sample size to test essentially all common SNPs in the human genome is only 5 times the sample size to test a single SNP.
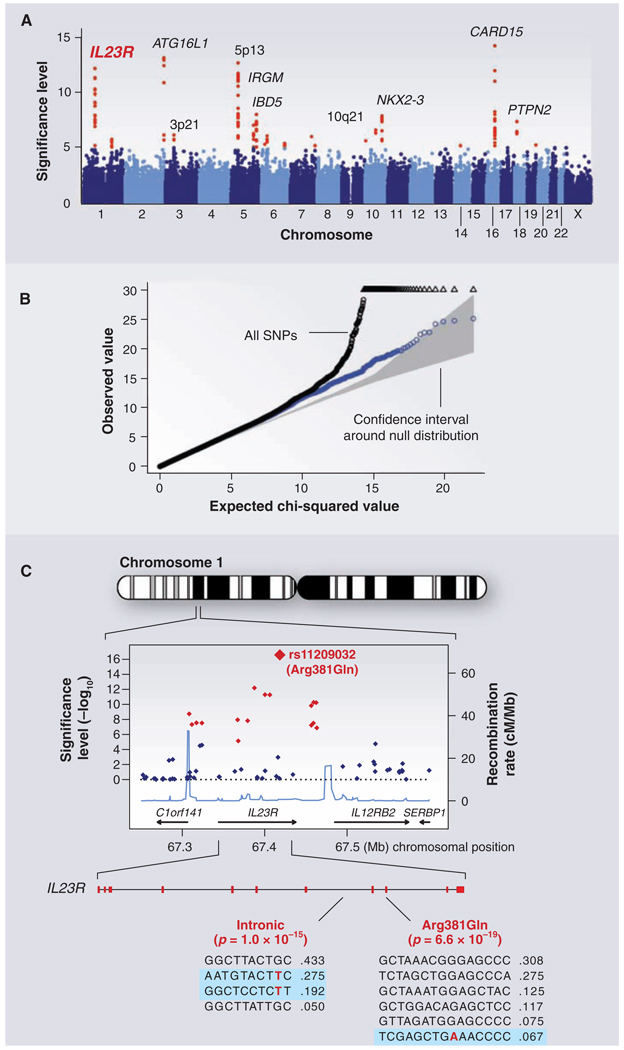
GWAS for Crohn's disease. The panels show data from the study of Crohn's disease by the Wellcome Trust Case Control Consortium. (A) Significance level (P value on log10 scale) for each of the 500,000 SNPs tested across the genome. SNP locations reflect their positions across the 23 human chromosomes. SNPs with significance levels exceeding 10−5 (corresponding to 5 on the y axis) are colored red; the remaining SNPs are in blue. Ten regions with multiple significant SNPs are shown, labeled by their location or by the likely disease-related gene (e.g., IL23R on chromosome 1). (B) The fact that the SNPs in red are extreme outliers is made clear from a so-called Q-Q plot. A Q-Q plot is made as follows: The SNPs are ordered (from 1 to n) according to their observed P values; observed and expected P values are plotted for each SNP. Under the null distribution, the expected P value for the ith SNP is i/n. If there are no significant associations, the Q-Q plot will lie along the 45° line; the gray region corresponds to a 95% confidence region around this null expectation. Black points correspond to all 500,000 SNPs studied that passed strict quality control; they diverge strongly from the null expectation. Blue points reflect the P values that remain when the SNPs in the 10 most significant regions are removed; there is still some excess of significant P values, indicating the presence of additional loci of more modest effect. (C) Close-up of the region around the IL23R locus on chromosome 1. The first part shows the significance levels for SNPs in a region of ~400 kb, with colors as in (A). The highest significance level occurs at a SNP in the coding region of the IL23R gene (causing an Arg381 → Gln change). The light blue curve shows the inferred local rate of recombination across the region. There are two clear hotspots of recombination, with SNPs lying between these hotspots being strongly correlated in a few haplotypes. The second part shows that the IL23R locus harbors at least two independent, highly significant disease-associated alleles. The first site is the Arg381 → Gln polymorphism, which has a single disease-associated haplotype (shaded in blue) with frequency of 6.7%. The second site is in the intron between exons 7 and 8; it tags two disease-associated haplotypes with frequencies of 27.5% and 19.2%.
References
Publication types
MeSH terms
Grants and funding
LinkOut - more resources
Full Text Sources
Other Literature Sources
