. 2008 Nov 7;322(5903):963-6.
doi: 10.1126/science.1161566.

Promoting axon regeneration in the adult CNS by modulation of the PTEN/mTOR pathway

Affiliations

Promoting axon regeneration in the adult CNS by modulation of the PTEN/mTOR pathway

Kevin Kyungsuk Park et al. Science. .

Abstract

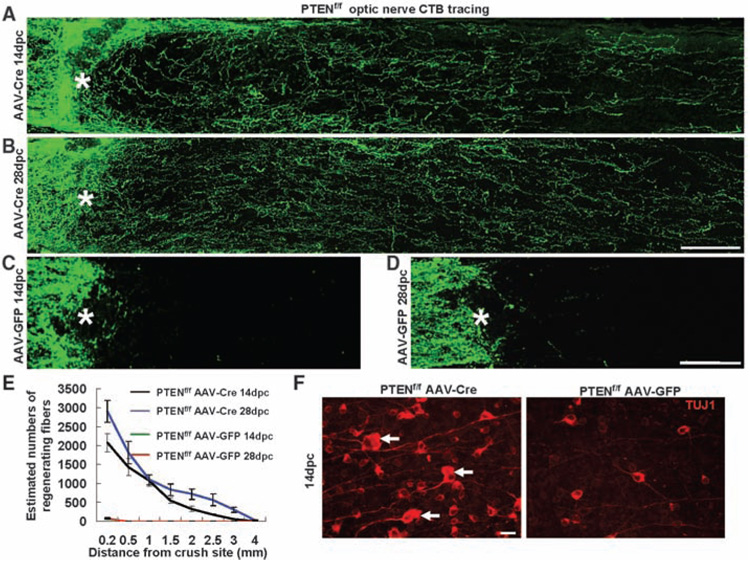
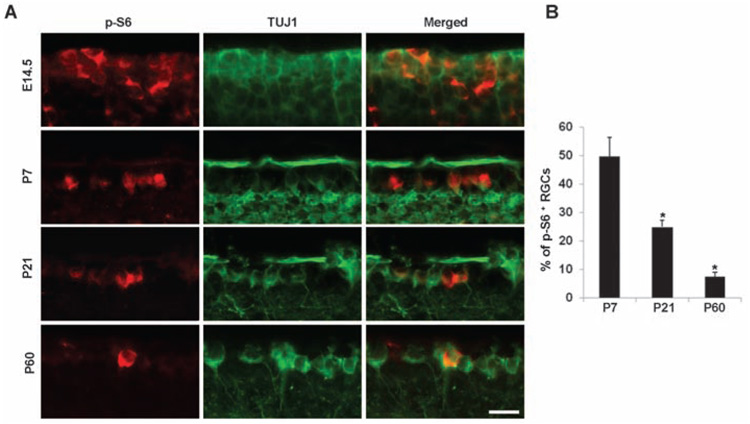
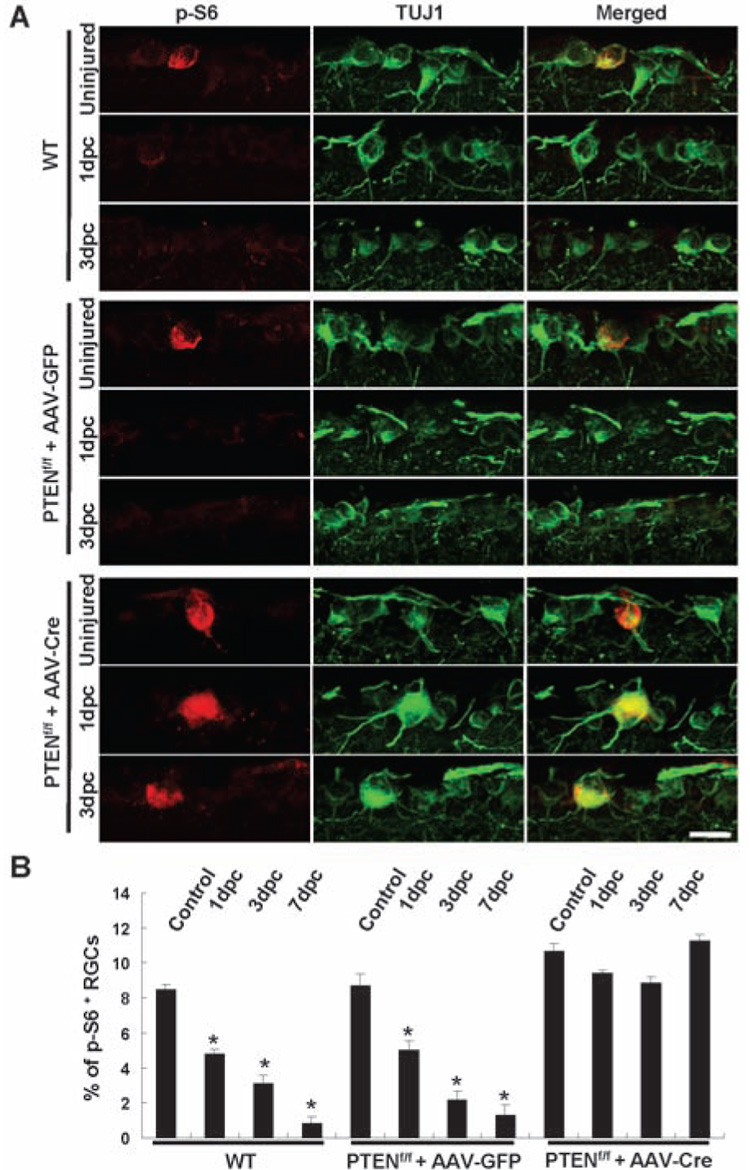
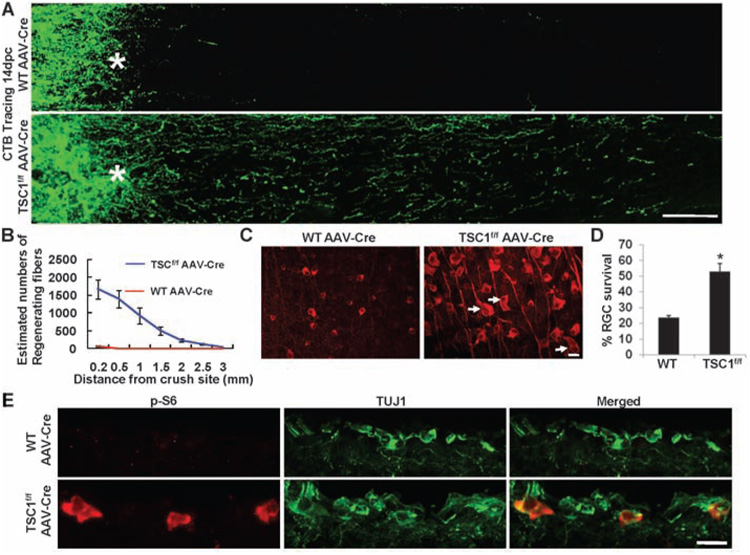
The failure of axons to regenerate is a major obstacle for functional recovery after central nervous system (CNS) injury. Removing extracellular inhibitory molecules results in limited axon regeneration in vivo. To test for the role of intrinsic impediments to axon regrowth, we analyzed cell growth control genes using a virus-assisted in vivo conditional knockout approach. Deletion of PTEN (phosphatase and tensin homolog), a negative regulator of the mammalian target of rapamycin (mTOR) pathway, in adult retinal ganglion cells (RGCs) promotes robust axon regeneration after optic nerve injury. In wild-type adult mice, the mTOR activity was suppressed and new protein synthesis was impaired in axotomized RGCs, which may contribute to the regeneration failure. Reactivating this pathway by conditional knockout of tuberous sclerosis complex 1, another negative regulator of the mTOR pathway, also leads to axon regeneration. Thus, our results suggest the manipulation of intrinsic growth control pathways as a therapeutic approach to promote axon regeneration after CNS injury.


Figures

Fig. 1
Fig. 1. PTEN deletion promotes RGC axon regeneration
(A to D) Confocal images of optic nerves showing CTB-labeled fibers around the lesion sites at 14 days [(A) and (C)] or 28 days [(B) and (D)] after injury from PTENf/f mice injected with AAV-Cre [(A) and (B)] or AAV-GFP [(C) and (D)]. Scale bar, 100 µm. (E) Quantification of regenerating fibers at different distances distal to the lesion sites. At least five different sections (every fourth section) from each animal were quantified. At both time points, there were significant differences between control and PTEN-deleted mice groups at every distance measured by analysis of variance with Bonferroni’s post-test [P < 0.05 for both 14 dpc (n = 7) and 28 dpc (n = 3)]. (F) Fluorescent photomicrographs of retinal whole-mounts showing surviving TUJ1+ RGCs at 14 days after injury. Arrows, RGCs with enlarged soma; *, crush site; scale bar, 20 µm.
Fig. 2
Fig. 2. Development-dependent decline of p-S6 signals in RGCs
Representative images (A) and quantification (B) of immunohistochemical analysis for p-S6 or TUJ1 immunoreactivity of the ganglion cell layer (GCL) of mouse retinas at different ages. Scale bar, 20 µm. Data are presented as mean percentages of p-S6+TUJ1+ cells among total TUJ1+ cells in the GCL of each retina. There is a significant difference in percentages of P21 and P60 when compared to that of P7. *, P < 0.01, Student’s t test. Cell counts were performed on at least four nonconsecutive sections, from three mice per age group.
Fig. 3
Fig. 3. Axotomy reduces p-S6 levels in RGCs in control but not in PTEN-deleted RGCs
(A) Immunofluorescence analysis with antibodies to p-S6 or TUJ1 of the retinal sections from wild-type or PTENf/f mice injected with AAV-GFP or AAV-Cre in different animal groups. Scale bar, 20 µm. (B) Quantification of p-S6+ RGCs. Data are presented as mean percentages of p-S6+TUJ1+ cells among total TUJ1+ cells in the GCL of each retina. Cell counts were performed on at least four nonconsecutive sections, from three mice per group. *, P < 0.01 by Dunnett’s test. Comparisons were made against the uninjured control retinas.
Fig. 4
Fig. 4. TSC1 deletion promotes RGC survival and axon regeneration after optic nerve crush
(A) Confocal images of optic nerves spanning lesion sites from wild-type or TSC1f/f mice injected with AAV-Cre at 14 days after crush. Scale bar, 100 µm. (B) Quantification of regenerating fibers in different groups. There is a significant difference between control and TSC1-deleted groups by Student’s t test at each distance (P < 0.05). (C) Fluorescent photomicrographs of retinal whole-mounts showing characteristic surviving TUJ1+ RGCs. Arrows, RGCs with enlarged soma; *, crush site; scale bar, 20 µm. (D) RGC survival at 14 dpc, expressed as a percentage of the total number of TUJ1+ RGCs in the uninjured retina. *, P < 0.05, Student’s t test. (E) Immunofluorescence analysis of the retinal sections from AAV-Cre–injected wild-type or TSC1f/f mice at 14 days after injury with antibodies to p-S6 or TUJ1. Scale bar, 20 µm.

Comment in

References

    1. Schwab ME, Bartholdi D. Physiol. Rev. 1996;79:319. - PubMed
    1. Goldberg JL, Klassen MP, Hua Y, Barres BA. Science. 2002;296:1860. - PubMed
    1. Filbin MT. Philos. Trans. R. Soc. London B Biol. Sci. 2006;361:1565. - PMC - PubMed
    1. Fitch MT, Silver J. Exp. Neurol. 2008;209:294. - PMC - PubMed
    1. Case LC, Tessier-Lavigne M. Curr. Biol. 2005;15:R749. - PubMed

Publication types

MeSH terms