. 2008 Nov-Dec;14(6):1603-10.
doi: 10.1109/TVCG.2008.123.

Effective visualization of complex vascular structures using a non-parametric vessel detection method

Affiliations

Effective visualization of complex vascular structures using a non-parametric vessel detection method

Alark Joshi et al. IEEE Trans Vis Comput Graph. 2008 Nov-Dec.

Abstract

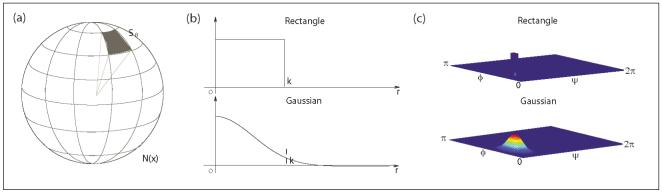
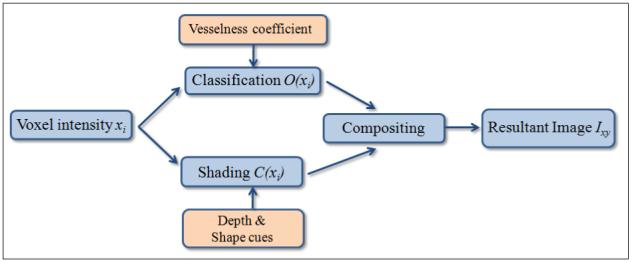
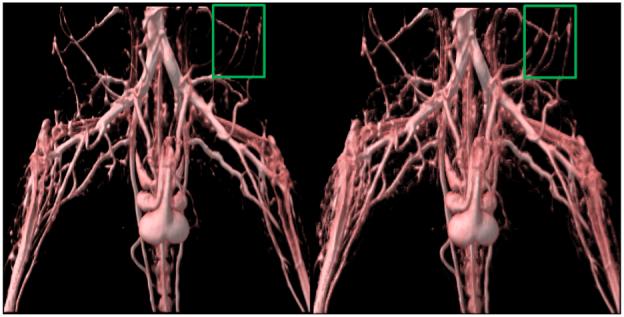
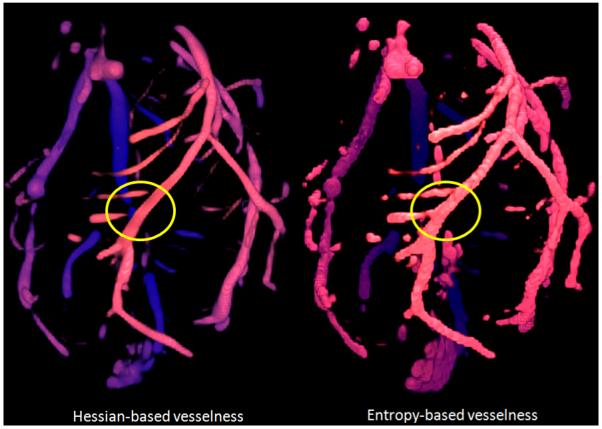
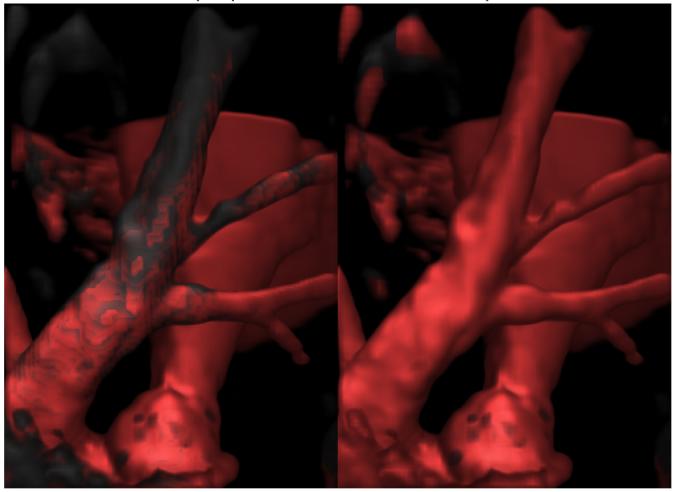
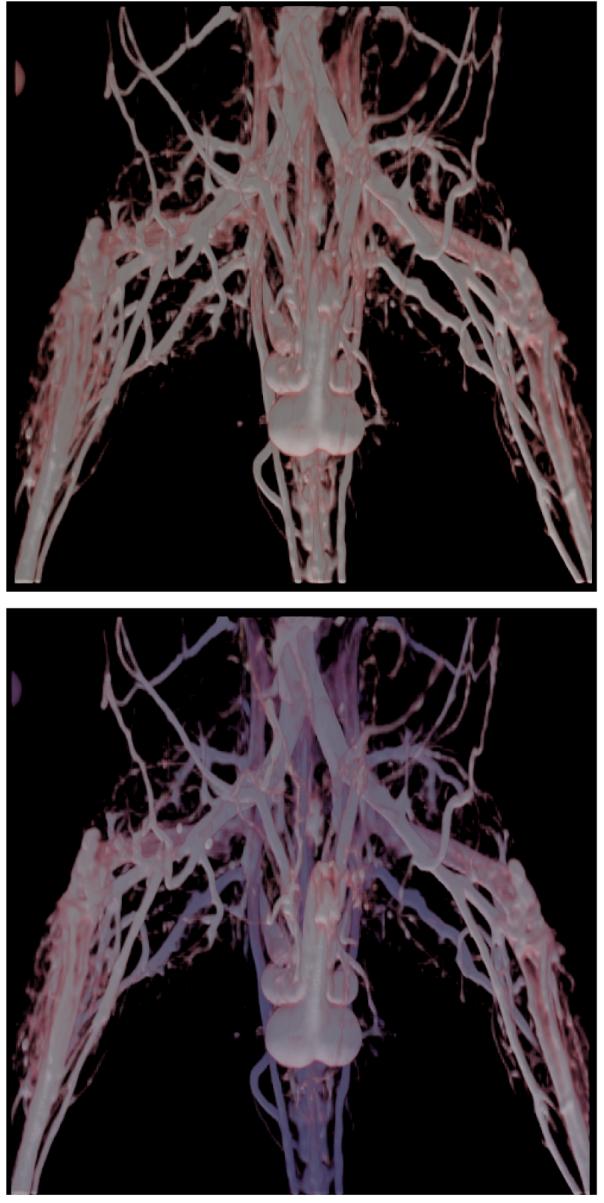
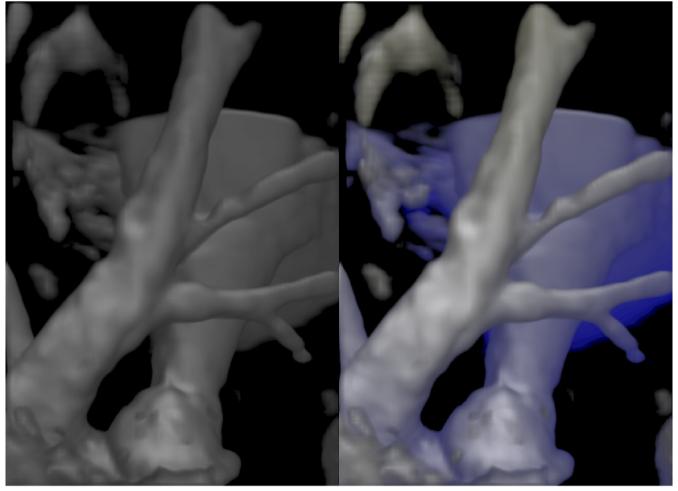
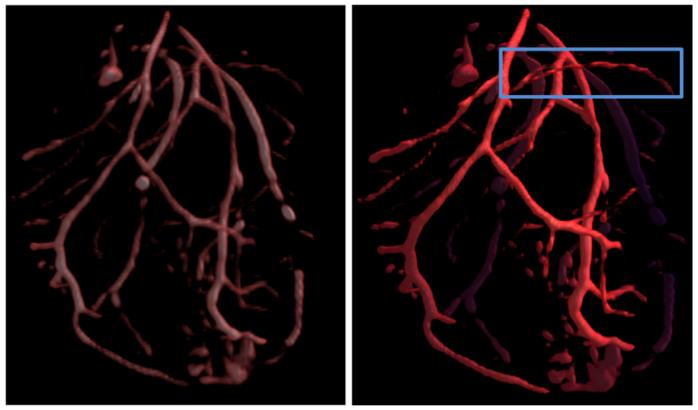
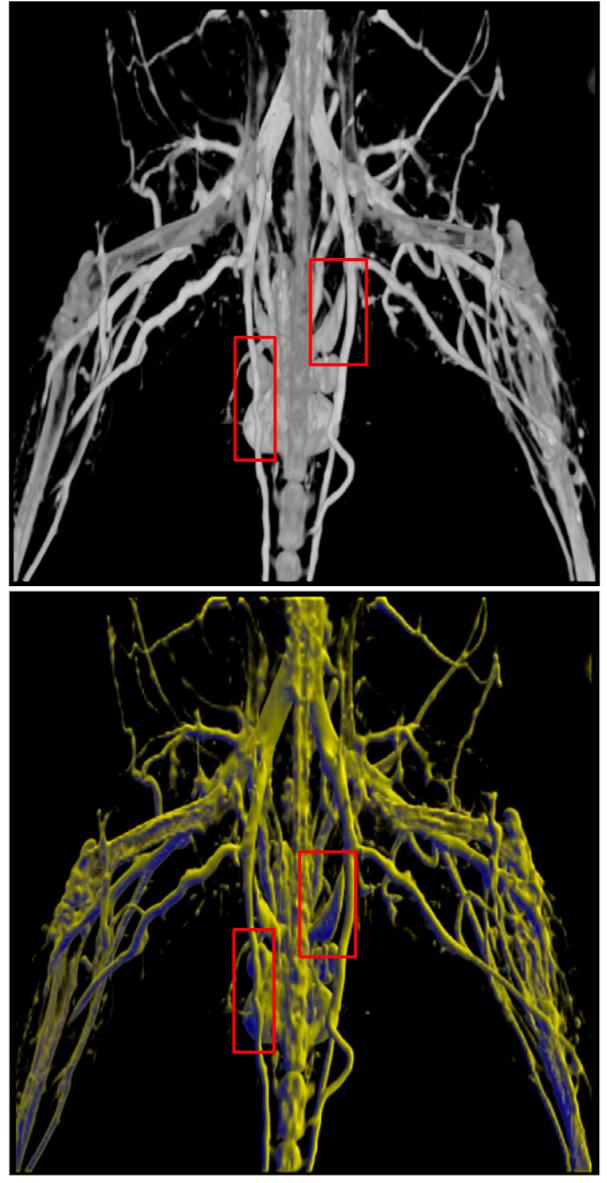
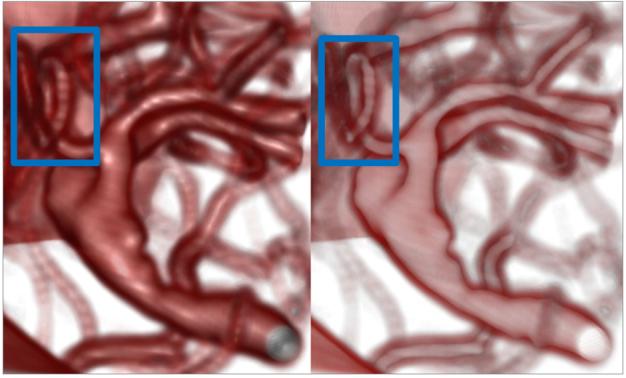
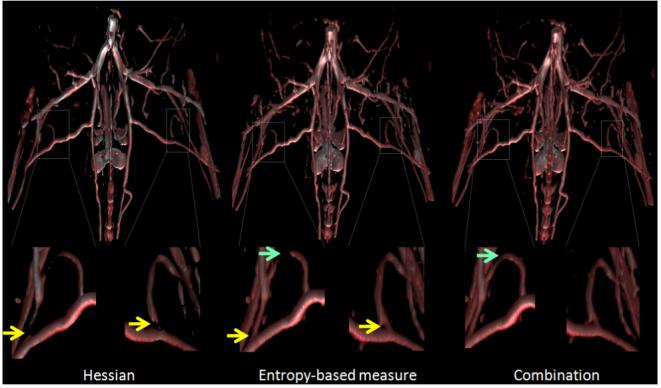
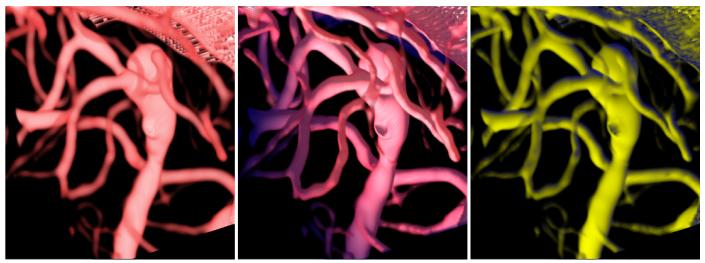
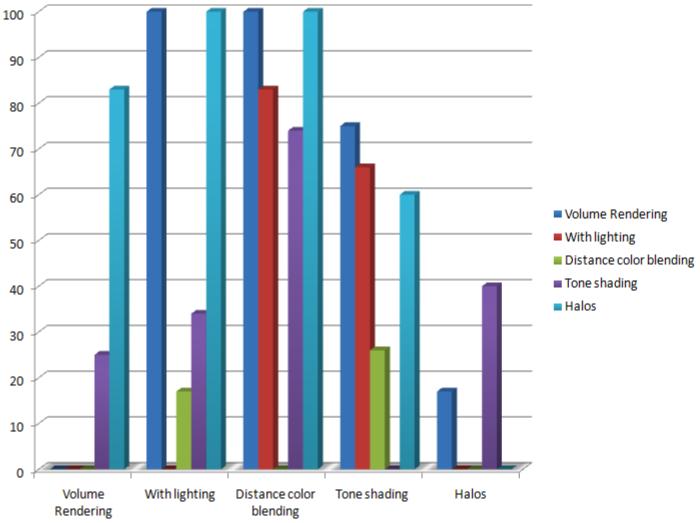
The effective visualization of vascular structures is critical for diagnosis, surgical planning as well as treatment evaluation. In recent work, we have developed an algorithm for vessel detection that examines the intensity profile around each voxel in an angiographic image and determines the likelihood that any given voxel belongs to a vessel; we term this the "vesselness coefficient" of the voxel. Our results show that our algorithm works particularly well for visualizing branch points in vessels. Compared to standard Hessian based techniques, which are fine-tuned to identify long cylindrical structures, our technique identifies branches and connections with other vessels. Using our computed vesselness coefficient, we explore a set of techniques for visualizing vasculature. Visualizing vessels is particularly challenging because not only is their position in space important for clinicians but it is also important to be able to resolve their spatial relationship. We applied visualization techniques that provide shape cues as well as depth cues to allow the viewer to differentiate between vessels that are closer from those that are farther. We use our computed vesselness coefficient to effectively visualize vasculature in both clinical neurovascular x-ray computed tomography based angiography images, as well as images from three different animal studies. We conducted a formal user evaluation of our visualization techniques with the help of radiologists, surgeons, and other expert users. Results indicate that experts preferred distance color blending and tone shading for conveying depth over standard visualization techniques.


Figures

Fig. 1
Fig. 1
Partition 3D neighborhood regions into oriented regions: (a) Partitions; (b) Radial part of the filter (k is the radius/size of the filter); (c) Angular part of the filter
Fig. 2
Fig. 2
The vessel enhancing volume rendering pipeline. The volume rendering pipeline was modified to incorporate for the needs of vessel visualization. The identified vessels are incorporated into the classification stage to boost the opacity of voxels with low intensity (thin vessels) but high vesselness. Depth and shape cues are provided in the shading phase.
Fig. 3
Fig. 3
A comparison of standard transfer function-based volume rendering with the modified vesselness-based volume rendering. Islands caused due to transfer function-based lower threshold cutoffs are visible, particularly in the region marked by the green rectangle. Comparing that with the right image, one can see that almost all vessels are completely connected. The modified vesselness pipeline leads to the visualization of vessels with far fewer islands as can be seen in the right image.
Fig. 4
Fig. 4
Visualization using polar profile compared to visualization using Hessian techniques. The regions marked with a yellow circle clearly show that our technique performs better at branch points.
Fig. 5
Fig. 5
Visualizations of vesselness for lamb MR angiography. The left image shows the raw data (in greyscale) colored with the Hessian coefficient (in red) being used with our modified volume rendering pipeline. Even though the Hessian technique can identify vessels, it cannot identify branch points as can be seen by the grey regions in the front vessel. The right image shows our polar profile-based vesselness which identifies the vessels as well as the branch points.
Fig. 6
Fig. 6
The top image shows a volume rendered image with lighting. The bottom image shows the same image with distance color blending added on to provide depth cues. The vessels that are farther from the viewer are shaded with a darker shade of blue mixed with their original color.
Fig. 7
Fig. 7
The left image shows a vesselness enhanced volume rendered visualization of the pulmonary artery of a lamb obtained from a MR angiography study. The right image shows a visualization with distance color blending conveying depth to the viewer. The parameters used for distance color blending are kds = 1.0,kde = 0.5,cb = (0,0,0.15).
Fig. 8
Fig. 8
Visualization with volume rendering and distance color blending with enhanced vesselness. The right enhanced vesselness visualization shows thin vessels more clearly, particularly in the region marked by the blue rectangle. Distance color blending helps us understand that the vessel is closer to the viewer than farther away.
Fig. 9
Fig. 9
The top image shows a volume rendered image where distance and shape cues are not clearly seen. The bottom image shows a visualization with tone shading. Particularly, in the regions marked by the red rectangles, shape and orientation is being conveyed due to tone shading.
Fig. 10
Fig. 10
Volume rendering of an aneurysm with lighting and with halos. In particular, the shape of the left vessel coming out of the top of the aneurysm is clearly seen in the right image, as compared to the left image. The parameters for halos were khpe = 2.0,khse = 5.0
Fig. 11
Fig. 11
Vascular visualization of lower mouse pelvic data using Hessian, polar neighborhood profile and a combination technique. The yellow arrows indicate regions where the polar profile-based technique identifies vessel branch points better than Hessian technique. The green arrows indicate where the combination technique works better than both Hessian or polar profile used independently.
Fig. 12
Fig. 12
Visualizations of vessels around a brain aneurysm. The left image shows a standard volume rendering of the vessels. The clutter of vessels makes its hard to resolve which vessels are in front of which vessels. The middle image shows a vesselness enhanced visualization with distance color blending where the vessels that are farther away are colored in a shade of blue. The rightmost image is obtained by using tone shading. The shape and orientation of the vessels comes through, but depth information is not as clearly conveyed.
Fig. 13
Fig. 13
This graph shows the results of the user study. On the X-axis are all the techniques from the user study and on the Y-axis are the user preferences. For example, Volume rendering was preferred over tone shading 24.58% of the time, while subjects preferred plain volume rendering over halos 83.17% of the time. Notably, Distance color blending was preferred over all other techniques (as can be seen by the high preference numbers). Tone shading too was preferred over other techniques. Halos was least preferred over other techniques except in some cases over tone shading.

References

    1. Bruckner S, Gröller ME. Enhancing depth-perception with flexible volumetric halos. IEEE Transactions on Visualization and Computer Graphics. 2007 Oct;13(6):1344–1351. - PubMed
    1. Bühler K, Felkel P, Cruz AL. Geometric methods for vessel visualization and quantification- a survey. In: Brunnett HMG, Hamann B, editors. Geometric Modelling for Scientific Visualization. 2003. Springer
    1. Chen CW, Huang TS. Epicardial motion and deformation estimation from coronary artery bifurcation points; Proc. Int. Conf. on Computer Vision; 1990.Dec., pp. 456–459.
    1. Cover TM, Thomas JA. Elements of Information Theory. Wiley; 1991.
    1. Frangi AF, Niessen WJ, Vincken KL, Viergever MA. Multiscale vessel enhancement filtering. Proc. of MICCAI, Lecture Notes in Computer Science. 1998;1496:130–137.

Publication types

MeSH terms