. 2008;3(11):e3673.
doi: 10.1371/journal.pone.0003673. Epub 2008 Nov 7.

An auxin transport-based model of root branching in Arabidopsis thaliana

Affiliations

An auxin transport-based model of root branching in Arabidopsis thaliana

Mikaël Lucas et al. PLoS One. 2008.

Abstract

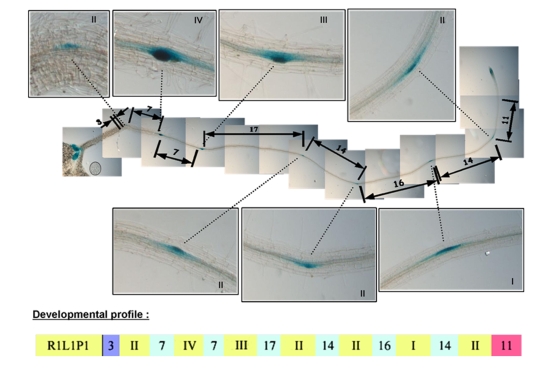
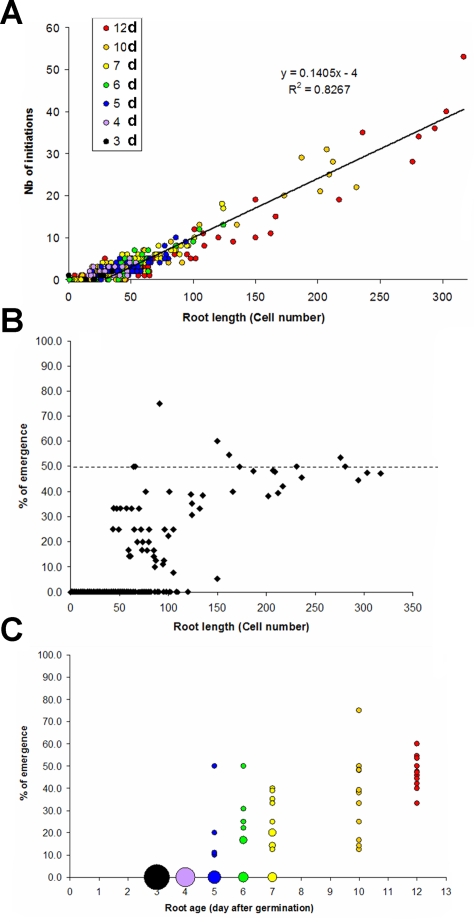
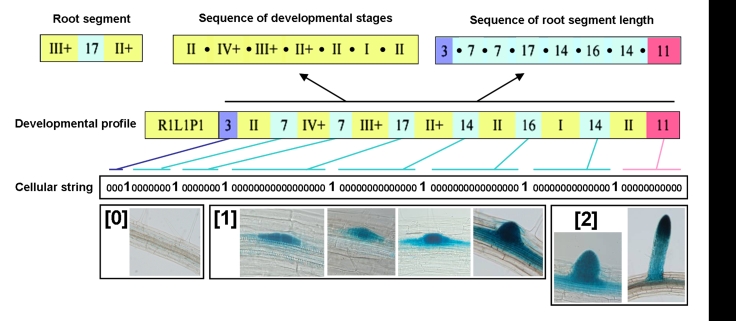
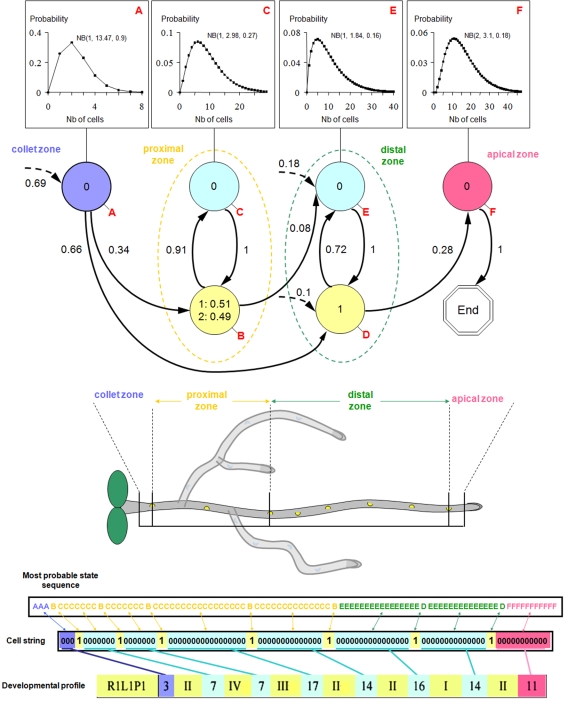
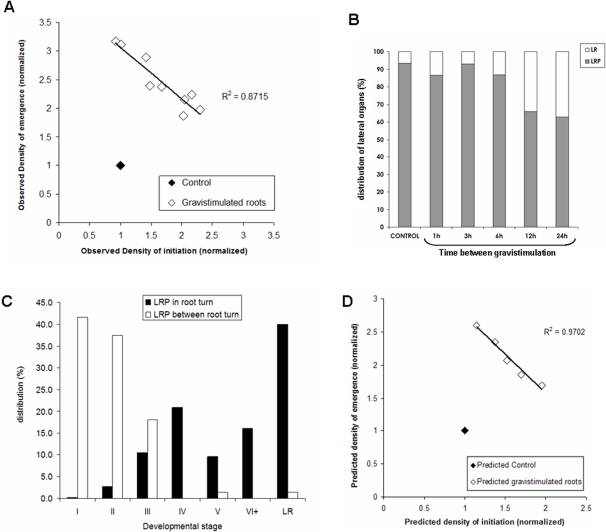
Root architecture is a crucial part of plant adaptation to soil heterogeneity and is mainly controlled by root branching. The process of root system development can be divided into two successive steps: lateral root initiation and lateral root development/emergence which are controlled by different fluxes of the plant hormone auxin. While shoot architecture appears to be highly regular, following rules such as the phyllotactical spiral, root architecture appears more chaotic. We used stochastic modeling to extract hidden rules regulating root branching in Arabidopsis thaliana. These rules were used to build an integrative mechanistic model of root ramification based on auxin. This model was experimentally tested using plants with modified rhythm of lateral root initiation or mutants perturbed in auxin transport. Our analysis revealed that lateral root initiation and lateral root development/emergence are interacting with each other to create a global balance between the respective ratio of initiation and emergence. A mechanistic model based on auxin fluxes successfully predicted this property and the phenotype alteration of auxin transport mutants or plants with modified rhythms of lateral root initiation. This suggests that root branching is controlled by mechanisms of lateral inhibition due to a competition between initiation and development/emergence for auxin.


Conflict of interest statement

Competing Interests: The authors have declared that no competing interests exist.

Figures

Figure 1
Figure 1. Encoding of root structure.
Transgenic seedlings (n = 397) aged 3 to 12 day and expressing the ProCYCB1:GUS marker were observed using a Leica DMRB microscope. The developmental stage of each primordium (indicated by Roman numerals) and the distance (measured in number of root hair cells) between them were scored along the primary root and emerged laterals. Each root was then assigned a unique identification code and developmental profile as illustrated here.
Figure 2
Figure 2. Macroscopic regularities of root development.
Each data point corresponds to a single primary or secondary root (n = 397). The color of the point indicates the age of the root when observation took place (3 to 12 days after germination). (A) The global number of lateral root primordia initiation is proportional to the total root length (measured in number of root hair cells). (B) The global emergence rate of lateral roots stabilizes around 50%. (C) Stabilization of emergence rate occurs after the first week of growth. Data point size indicates the relative number of similar observed values.
Figure 3
Figure 3. Encoding the root structure.
We defined three kinds of sequences based on developmental profiles. The sequence of developmental stages considers only the developmental stages of the successive lateral organs. The sequence of root segment length (root segment being defined as the unit formed by two successive organs and the distance between them) considers only the distances between the successive lateral organs. The cellular string sequence were obtained by transcoding and expanding the developmental profile. The transcoding of the developmental stages is shown below the cellular string: observed un-differentiated cells were coded as 0, non-emerged primordia were coded as 1, and emerged lateral roots were coded as 2.
Figure 4
Figure 4. Stochastic model of root development.
This model represents all observed developmental profiles (400 seedlings aged from 3 to 12 days). Each state is represented by a vertex which is labeled in red in its lower right corner (except the final end state). The possible transitions between states are represented by arcs with the attached probabilities noted nearby. Dotted arcs entering in states indicate initial states. The attached initial probabilities are noted nearby. Only arcs with attached initial or transition probabilities >0.03 are figured. The occupancy distributions of the semi-Markovian states A, C, E, and F are figured above the corresponding vertex. All these occupancy distributions are negative binomial distributions NB(d, r, p). The possible outputs in a state are noted in the corresponding vertex with the attached observation probabilities when <1. States B–C (respectively D–E) define the proximal (respectively distal) functional zones. The lower part of the panel present the most probable state sequence predicted for the given cell string.
Figure 5
Figure 5. Primordia and lateral roots distributions in the stochastic model.
The observed distributions (number of lateral organs of a given type per root) are extracted from the data while the theoretical distributions are computed from the estimated stochastic model.
Figure 6
Figure 6. Empirical distribution of root segment length in the proximal zone (state 2 in the stochastic model).
Figure 7
Figure 7. Distribution of the run length of emerged roots.
The observed distribution (i.e. number of successive emerged roots) is extracted from the data while the theoretical distributions are computed from an estimated first-order or variable-order Markov chain.
Figure 8
Figure 8. Mechanistic model of lateral root initiation and development.
(A) Structure of the model. Auxin reflux takes place though the initiation zone (IZ). A fraction of the reflux accumulates until the initiation threshold (IT) is reached. A new primordium then appears and depletes auxin in the IZ. Primordia going through the development zone (DZ) drain a percentage of the central auxin flux. Primordia will emerge if their auxin content is higher than the emergence threshold (ET). Emerged laterals cease consuming auxin. Primordia which have not yet emerged when they leave the DZ for the emergence zone (EZ) will stop developing. Gravistimulation is considered to induce a drop of IT and to consume a fraction of the auxin in the IZ. IT and ET both vary dynamically according to Gaussian distributions. Auxin production augments after one week. (B) Mathematical representation of the reflux system. Fluxes coming from the development and initiation zone are denoted as ΦD and ΦI. The reflux efficiencies are denoted α and β, while δ expresses auxin degradation in the meristem and in the IZ. (C) Auxin fluxes passing through the IZ at equilibrium. As the reflux is considered to be imperfect, the flux going through the IZ will reach a stable point depending on the efficiencies of the refluxes α and β and on the central flux entering the IZ from the DZ (value in arbitrary units of production per minute). For high values of reflux efficiency, a small variation in reflux efficiency or entering fluxes will lead to a strong change of stable point (black arrows).
Figure 9
Figure 9. Mechanistic model calibration and predictions.
(A & B) Initiation and emergence in the model were calibrated according to the observed mean initiation and emergence level (see figure 2). Runs of 20 simulations were done for each condition. Data point size indicates the relative number of simulations giving the same output. (C) Fit between model prediction and observation for various gravistimulation patterns (see Supplementary Figure S4 for additional details on the gravistimulation patterns). Runs of 20 simulations were done for each condition. (D) Predicted emergence rate and initiation level as a function of apical reflux. The color code indicates the reflux efficiency at the apex (reflux efficiency ranging from 20% to 99%). Runs of 20 simulations were done for each condition. (E) Predicted initiation level as a function of development level of primordia. Development of primordia in the model was either full or arrested at various level ranging from 4/5th of full development to no development at all. Runs of 20 simulations were done for each condition. Data point size indicates the relative number of simulations giving the same output. (F) Observed initiation and emergence densities in mutants and wild-type Col-0. Initiation and emergence densities were scored for the mutants pin2 and aux1, and normalized in regard to the emergence density of wild-type Col-0 plants. Data for the lax3 mutant were provided by Pr. Malcolm Bennett. Each data point corresponds to a set of more than 20 seedlings.
Figure 10
Figure 10. Gravistimulation enhanced balance between initiation and development.
(A) Initiation density and emerged lateral root density were scored for plants gravistimulated according to the gravistimulation protocol presented in . The results are given for primordia located in gravistimulated zones. Measurements were normalized in regard to the emergence density of non-gravistimulated plants. Each data point corresponds to a set of more than 20 seedlings. Non-gravistimulated Col-0 seedlings were used as a control group. (B) Emergence of lateral roots in gravistimulated roots. White bar: emerged lateral root percentage. Gray bar: non-emerged primordia percentage. Non gravistimulated Col-0 seedling were used as a control. (C) Distribution of primordia developmental stages for the 24 h time between gravistimulation treatment. White bar: primordia appearing and developing between gravistimulation (n = 72). Black bar: primordia appearing and developing in root turns (n = 373). (D) Initiation and emergence densities predicted by the mechanistic model with the added hypothesis of a drop of ET under gravistimulation.

References

    1. Douady S, Couder Y. Phyllotaxis as a physical self-organized growth process. Phys Rev Lett. 1992;68:2098–2101. - PubMed
    1. Malamy JE. Intrinsic and environmental response pathways that regulate root system architecture. Plant Cell & Env. 2005;28:67–77. - PubMed
    1. Hodge A. Plastic plants and patchy soils. J Exp Bot. 2006;57:401–411. - PubMed
    1. Casimiro I, Beeckman T, Graham N, Bhalerao R, Zhang H, et al. Dissecting Arabidopsis lateral root development. Trends Plant Sci. 2003;8:165–171. - PubMed
    1. De Smet I, Vanneste S, Inzé D, Beeckman T. Lateral root initiation or the birth of a new meristem. Plant Mol Biol. 2006;60:871–887. - PubMed

Publication types

MeSH terms