. 2008 Nov;4(11):e1000213.
doi: 10.1371/journal.pcbi.1000213. Epub 2008 Nov 7.

Transmembrane topology and signal peptide prediction using dynamic bayesian networks

Affiliations

Transmembrane topology and signal peptide prediction using dynamic bayesian networks

Sheila M Reynolds et al. PLoS Comput Biol. 2008 Nov.

Abstract

Hidden Markov models (HMMs) have been successfully applied to the tasks of transmembrane protein topology prediction and signal peptide prediction. In this paper we expand upon this work by making use of the more powerful class of dynamic Bayesian networks (DBNs). Our model, Philius, is inspired by a previously published HMM, Phobius, and combines a signal peptide submodel with a transmembrane submodel. We introduce a two-stage DBN decoder that combines the power of posterior decoding with the grammar constraints of Viterbi-style decoding. Philius also provides protein type, segment, and topology confidence metrics to aid in the interpretation of the predictions. We report a relative improvement of 13% over Phobius in full-topology prediction accuracy on transmembrane proteins, and a sensitivity and specificity of 0.96 in detecting signal peptides. We also show that our confidence metrics correlate well with the observed precision. In addition, we have made predictions on all 6.3 million proteins in the Yeast Resource Center (YRC) database. This large-scale study provides an overall picture of the relative numbers of proteins that include a signal-peptide and/or one or more transmembrane segments as well as a valuable resource for the scientific community. All DBNs are implemented using the Graphical Models Toolkit. Source code for the models described here is available at http://noble.gs.washington.edu/proj/philius. A Philius Web server is available at http://www.yeastrc.org/philius, and the predictions on the YRC database are available at http://www.yeastrc.org/pdr.


Conflict of interest statement

The authors have declared that no competing interests exist.

Figures

Figure 1
Figure 1. Hidden Markov model.
(a) BN with two variables which constitutes the basic (single frame) template for an HMM, and (b) A DBN representation of an HMM obtained by concatenating a variable number of the BN frames and connecting successive state variables.
Figure 2
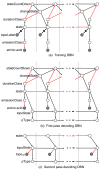
Figure 2. Philius training and decoding graphical models.
(a) Training DBN: only the amino acid and the topoLabel are observed in each frame. The topoLabel is used to constrain the hidden state using an observed child node. The color of the edge between two nodes indicates the type of relationship: black is deterministic, and red is random. (b) First stage decoding DBN: the topoState is hidden and dependent on the state and the previous topoState, and specifies the behavior of pType, an additional hidden variable. (c) Second stage decoding DBN: the observed amino acid node and the duration modeling nodes have been removed, and Pr[topoStatei] is defined by the posterior probabilities computed in the first stage using the virtual evidence node topoVE.
Figure 3
Figure 3. State transition diagram.
Each rectangle represents a state, which is characterized by an emission distribution and a duration distribution. The state transition topology of Philius exactly mimics that of Phobius.
Figure 4
Figure 4. Protein-type classification precision vs confidence score computed by sorting the proteins by score and computing the average score and precision within a sliding window.
Left: precision vs average score for each of the three main protein types. Right: average (black) and average ±one standard deviation (gray) across all proteins.
Figure 5
Figure 5. Segment-level classification precision vs score for each of the segment types (excluding the ‘outside’ segments of G and SP+G proteins).
Figure 6
Figure 6. Full-topology prediction precision vs score for the TM proteins.
The black line is the average score within the sliding window used to estimate the precision, and the gray lines indicate the average plus and minus one standard deviation.
Figure 7
Figure 7. Original Phobius datasets (G, SP+G, TM and SP+TM) and new SignalP and SCAMPI datasets.
Figure is approximately to scale.
Figure 8
Figure 8. The total counts and fraction of correct C-terminal localizations as a function of C-terminal segment confidence score for 546 yeast proteins with experimentally assigned C-terminal locations.
Figure 9
Figure 9. Philius topology prediction for the human presenilin protein as shown on the YRC web-page.
The diagram shows the nine membrane-spanning regions as vertical cylinders, and the cytoplasmic and non-cytoplasmic segments as horizontal bars. Each segment is colored according to type and shaded according to the confidence score. The seventh membrane-helix is missed by many topology predictors and is assigned a relatively low confidence score by Philius and as such is shaded gray. Because of this one low-confidence membrane segment, the location of the C-terminus is less confidently assigned than the location of the N-terminus. On the YRC web page, this diagram is accompanied by the type confidence and topology confidence, as well as a copy of the protein sequence, color coded by segment type. Placing the mouse over any part of the topology diagram or the color-coded sequence will produce a pop-up showing the segment type, confidence, and boundary locations.

References

    1. Sonnhammer E, von Heijne G, Krogh A. A hidden Markov model for predicting transmembrane helices in protein sequences. Proc ISMB. 1998;6:175–182. - PubMed
    1. Tusnady G, Simon I. Principles governing amino acid composition of integral membrane proteins: application to topology prediction. J Mol Biol. 1998;283:489–506. - PubMed
    1. Schwartz R, Chow YL. The N-best algorithms: an efficient and exact procedure for finding the N most likely sentence hypotheses. IEEE Int Conf Acoust Speech Signal Process. 1990;1:81–84.
    1. Tusnady G, Simon I. The HMMTOP transmembrane topology prediction server. Bioinformatics. 2001;17:849–850. - PubMed
    1. Nielsen H, Krogh A. Prediction of signal peptides and signal anchors by a hidden Markov model. Proc ISMB. 1998;6:122–30. - PubMed

Publication types