. 2008 Nov;4(11):e1000249.
doi: 10.1371/journal.pgen.1000249. Epub 2008 Nov 7.

High-resolution copy-number variation map reflects human olfactory receptor diversity and evolution

Affiliations

High-resolution copy-number variation map reflects human olfactory receptor diversity and evolution

Yehudit Hasin et al. PLoS Genet. 2008 Nov.

Abstract

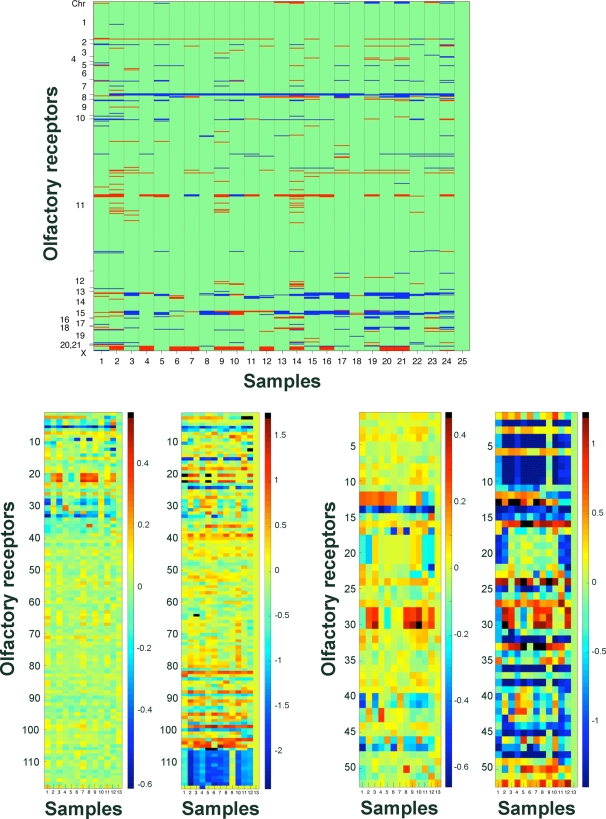
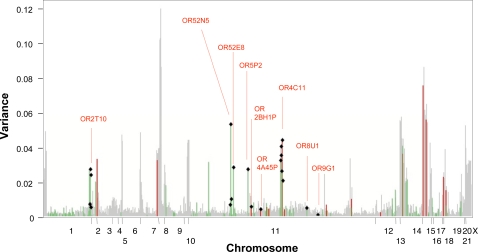
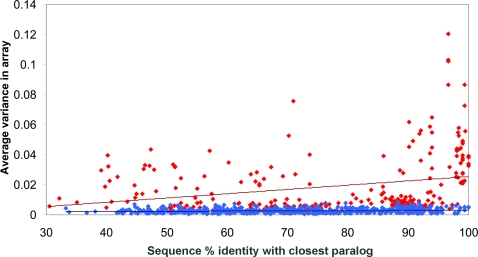
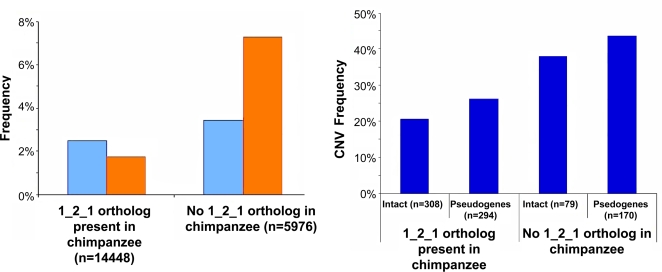
Olfactory receptors (ORs), which are involved in odorant recognition, form the largest mammalian protein superfamily. The genomic content of OR genes is considerably reduced in humans, as reflected by the relatively small repertoire size and the high fraction ( approximately 55%) of human pseudogenes. Since several recent low-resolution surveys suggested that OR genomic loci are frequently affected by copy-number variants (CNVs), we hypothesized that CNVs may play an important role in the evolution of the human olfactory repertoire. We used high-resolution oligonucleotide tiling microarrays to detect CNVs across 851 OR gene and pseudogene loci. Examining genomic DNA from 25 individuals with ancestry from three populations, we identified 93 OR gene loci and 151 pseudogene loci affected by CNVs, generating a mosaic of OR dosages across persons. Our data suggest that approximately 50% of the CNVs involve more than one OR, with the largest CNV spanning 11 loci. In contrast to earlier reports, we observe that CNVs are more frequent among OR pseudogenes than among intact genes, presumably due to both selective constraints and CNV formation biases. Furthermore, our results show an enrichment of CNVs among ORs with a close human paralog or lacking a one-to-one ortholog in chimpanzee. Interestingly, among the latter we observed an enrichment in CNV losses over gains, a finding potentially related to the known diminution of the human OR repertoire. Quantitative PCR experiments performed for 122 sampled ORs agreed well with the microarray results and uncovered 23 additional CNVs. Importantly, these experiments allowed us to uncover nine common deletion alleles that affect 15 OR genes and five pseudogenes. Comparison to the chimpanzee reference genome revealed that all of the deletion alleles are human derived, therefore indicating a profound effect of human-specific deletions on the individual OR gene content. Furthermore, these deletion alleles may be used in future genetic association studies of olfactory inter-individual differences.


Conflict of interest statement

The authors have declared that no competing interests exist.

Figures

Figure 1
Figure 1. A high-resolution map of CNVs in the human OR repertoire.
A) CNV map for OR loci based on high-resolution oligonucleotide tiling arrays. 851 ORs are ordered according to their location along the chromosomes, as indicated on the left; rows represent genes, columns are individuals; gains are shown in red, losses in blue and un-changed dosage in green (calls were made relative to the male reference individual NA19154). Note that the non-uniform genomic distribution of ORs results in an unbalanced representation of chromosomes in panel A. Also, note that ‘gains’ on chromosome X do not represent CNVs but refer to the expected male/female dosage difference. CNV calls are given for all 25 individuals (i.e. a self-vs.-self-replicate of NA19154 was included as a control; see Methods). Due to the resolution of the figure single CNVs may not be visible (all events are given in Table S2). Samples appear in the following order (1–25); NA10851, NA11997, NA12003, NA12004, NA12005, NA12006, NA12246, NA12248, NA12865, NA15510, NA18501, NA18502, NA18504, NA18505, NA18506, NA18508, NA18611, NA18856, NA18945, NA18946, NA18972, NA19103, NA19128, NA19141, NA19154. B) qPCR and microarray measurements of 122 OR loci for 13 individuals. The right panel represents qPCR results, and the left panel the corresponding microarray measurements (i.e. the measure R; see Methods). Sixty of the 122 ORs were tested in 13 individuals, thus only data for these samples is shown (for the full dataset, see Table S1). OR loci were sorted based on copy-number variability as assessed with our microarrays; the top 40 rows represent genes categorized as CNVs by microarrays; the lower part refers to loci not scored as a CNVs with the arrays, but scored as CNVs by qPCR (see Table 2). qPCR data was normalized relative to NA19154, and inverted (values multiplied with −1) to fit to the microarray scale. OR2BH1P and OR9G1 showed homozygous deletion in the reference individual, thus the qPCR values of these ORs were not normalized. Relative intensities are color coded, as indicated by the color scales. Homozygously deleted OR alleles are shown in the right panel in black. Samples appear in the following order; NA12003, NA12004, NA12005, NA12006, NA12246, NA12248, NA12865, NA18504, NA18508, NA18856, NA19103, NA19141, NA19154. C) qPCR-measurements and array (R) measures for the 56 most variable OR loci. The most variable OR loci were selected based on variance in qPCR results. Representation and sample order is as in panel B.
Figure 2
Figure 2. Copy-number variability expressed as variance of experimental measures.
Variance in array measurements is indicated along OR loci, with loci arranged according to genomic coordinates. The variance of individual array measurements for each OR is plotted in grey. Array variance of ORs that were assayed by qPCR is color-coded; green: OR genes; red: OR pseudogenes. Black squares indicate ORs listed in Table 3; representative ORs from each cluster are indicated by red doted lines.
Figure 3
Figure 3. Correlation of OR copy-number variability with paralog-similarity.
Red and blue dots indicate copy-number variable and non-variable ORs, respectively (copy-number variability is expressed in terms of the measure R, see Methods, which we found to correlate well with gene dosage). Percentage DNA sequence identity (“% identity”) to the closest paralog in the human genome is plotted versus the array-based (i.e., R-measure-based) variance. Correlation for ORs affected by CNVs is C = 0.26 (Pvalue = 10−5), whereas for non-variable ORs it is C = 0.15 (Pvalue = 10−4). Linear regression fits for each dataset are indicated with red and blue dashed lines, respectively.
Figure 4
Figure 4. CNVs preferentially affect ORs lacking unambiguous one-to-one orthologs in the chimpanzee genome.
A) Gains and losses of OR loci were called using our microarrays (see Methods). Gains are shown in blue; losses in orange; n is the number of total calls considered (24 samples multiplied by the number of genes in each category). OR loci with a one-to-one (“1-2-1”) ortholog in the chimpanzee genome are significantly (Pvalue<0.001; Mann-Whitney U test) less often affected by CNVs than loci lacking a 1-2-1 ortholog. B) Frequencies of CNV loci are given separately for intact OR genes and pseudogenes in each of the evolutionary classes. “Frequency”: relative frequency of being called a CNV for a set.
Figure 5
Figure 5. Zoom into a bi-allelic CNV affecting OR4C11.
Plot depicting median normalized log2-ratios of microarray intensities for OR loci affected by deletion I (chr11: 55127497–55238834), a bi-allelic CNV. Each individual is color-coded as indicated in the legend shown to the right. Black arrows indicate samples that consistently failed to produce results in the qPCR and standard PCR assays, indicating a potential homozygous deletion.

References

    1. Hummel T, Nordin S. Olfactory disorders and their consequences for quality of life. Acta Otolaryngol. 2005;125:116–121. - PubMed
    1. Buck L, Axel R. A novel multigene family may encode odorant receptors: A molecular basis for odor recognition. Cell. 1991;65:175–187. - PubMed
    1. Beites CL, Kawauchi S, Crocker CE, Calof AL. Identification and molecular regulation of neural stem cells in the olfactory epithelium. Exp Cell Res. 2005;306:309–316. - PubMed
    1. Glusman G, Yanai I, Rubin I, Lancet D. The Complete Human Olfactory Subgenome. Genome Res. 2001;11:685–702. - PubMed
    1. Kambere MB, Lane RP. Co-regulation of a large and rapidly evolving repertoire of odorant receptor genes. BMC Neurosci 8 Suppl. 2007;3:S2. - PMC - PubMed

Publication types

Substances