Response properties of mouse trigeminal ganglion neurons
- PMID: 18989828
- PMCID: PMC2597100
- DOI: 10.1080/08990220802467612
Response properties of mouse trigeminal ganglion neurons
Abstract
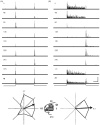
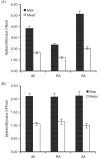
We used controlled whisker deflections to examine the response properties of 208 primary afferent neurons in the trigeminal ganglion of adult mice. Proportions of rapidly adapting (RA, 47%) and slowly adapting (SA, 53%) neurons were equivalent, and most cells had low or no spontaneous activity. We quantified angular tuning and sensitivity to deflection amplitude and velocity. Both RA and SA units fired more frequently to larger deflections and faster deflections, but RA units were more sensitive to differences in velocity whereas SA units were more sensitive to deflection amplitudes. Almost all neurons were tuned for deflection angle, and the average response to the maximally effective direction was more than fourfold greater than the average response in the opposite direction; SA units were more tuned than RA units. Responses of primary afferent whisker-responsive neurons are qualitatively similar to those of the rat. However, average firing rates of both RA and SA neurons in the mouse are less sensitive to differences in deflection velocity, and RA units, unlike those in the rat, display amplitude sensitivity. Subtle observed differences between mice and rats may reflect greater mechanical compliance in mice of the whisker hairs and of the tissue in which they are embedded.
Figures


Similar articles
-
Coding of deflection velocity and amplitude by whisker primary afferent neurons: implications for higher level processing.Somatosens Mot Res. 2000;17(2):171-80. doi: 10.1080/08990220050020580. Somatosens Mot Res. 2000. PMID: 10895887
-
Whisker plucking alters responses of rat trigeminal ganglion neurons.Somatosens Mot Res. 2003;20(3-4):233-8. doi: 10.1080/08990220310001622951. Somatosens Mot Res. 2003. PMID: 14675962
-
Protracted development of responses to whisker deflection in rat trigeminal ganglion neurons.J Neurophysiol. 2003 Sep;90(3):1432-7. doi: 10.1152/jn.00419.2003. Epub 2003 Jun 11. J Neurophysiol. 2003. PMID: 12801899
-
Physiological and anatomical consequences of infraorbital nerve transection in the trigeminal ganglion and trigeminal spinal tract of the adult rat.J Neurosci. 1989 Feb;9(2):548-57. doi: 10.1523/JNEUROSCI.09-02-00548.1989. J Neurosci. 1989. PMID: 2783964 Free PMC article.
-
Effect of neonatal capsaicin and infraorbital nerve section on whisker-related patterns in the rat trigeminal nucleus.J Comp Neurol. 1997 Sep 8;385(4):599-615. doi: 10.1002/(sici)1096-9861(19970908)385:4<599::aid-cne6>3.0.co;2-z. J Comp Neurol. 1997. PMID: 9302107 Review.
Cited by
-
The cellular and molecular basis of direction selectivity of Aδ-LTMRs.Cell. 2014 Dec 18;159(7):1640-51. doi: 10.1016/j.cell.2014.11.038. Cell. 2014. PMID: 25525881 Free PMC article.
-
Weaker feedforward inhibition accounts for less pronounced thalamocortical response transformation in mouse vs. rat barrels.J Neurophysiol. 2013 Nov;110(10):2378-92. doi: 10.1152/jn.00574.2012. Epub 2013 Aug 21. J Neurophysiol. 2013. PMID: 23966677 Free PMC article.
-
Angular Tuning Properties of Low Threshold Mechanoreceptors in Isolated Rat Whisker Hair Follicles.eNeuro. 2022 Nov 28;9(6):ENEURO.0175-22.2022. doi: 10.1523/ENEURO.0175-22.2022. Print 2022 Nov-Dec. eNeuro. 2022. PMID: 36376066 Free PMC article.
-
Representation of Stimulus Speed and Direction in Vibrissal-Sensitive Regions of the Trigeminal Nuclei: A Comparison of Single Unit and Population Responses.PLoS One. 2016 Jul 27;11(7):e0158399. doi: 10.1371/journal.pone.0158399. eCollection 2016. PLoS One. 2016. PMID: 27463524 Free PMC article.
-
Demonstration of three-dimensional contact point determination and contour reconstruction during active whisking behavior of an awake rat.PLoS Comput Biol. 2022 Sep 15;18(9):e1007763. doi: 10.1371/journal.pcbi.1007763. eCollection 2022 Sep. PLoS Comput Biol. 2022. PMID: 36108064 Free PMC article.
References
-
- Berger T, Borgdorff A, Crochet S, Neubauer FB, Lefort S, Fauvet B, Ferezou I, Carleton A, Luscher HR, Petersen CC. Combined voltage and calcium epifluorescence imaging in vitro and in vivo reveals subthreshold and suprathreshold dynamics of mouse barrel cortex. J Neurophysiol. 2007;97:3751–3762. - PubMed
-
- Brecht M, Preilowski B, Merzenich MM. Functional architecture of the mystacial vibrissae. Behav Brain Res. 1997;84:81–97. - PubMed
-
- Carvell GE, Simons DJ. Task- and subject-related differences in sensorimotor behavior during active touch. Somatosens Mot Res. 1995;12:1–9. - PubMed
Publication types
MeSH terms
Grants and funding
LinkOut - more resources
Full Text Sources
