

The effect of interferon beta-1b on size of short-lived enhancing lesions in patients with multiple sclerosis
- PMID: 18990070
- PMCID: PMC3621792
- DOI: 10.1517/14712590802510629
The effect of interferon beta-1b on size of short-lived enhancing lesions in patients with multiple sclerosis
Abstract
Background: Contrast enhancing lesions (CELs) in MRI represent inflammatory events in multiple sclerosis (MS). IFN-beta-1b decreases the formation of CELs. However, the ability of IFN-beta-1b to reduce the size of CELs arising during therapy has not been extensively investigated.
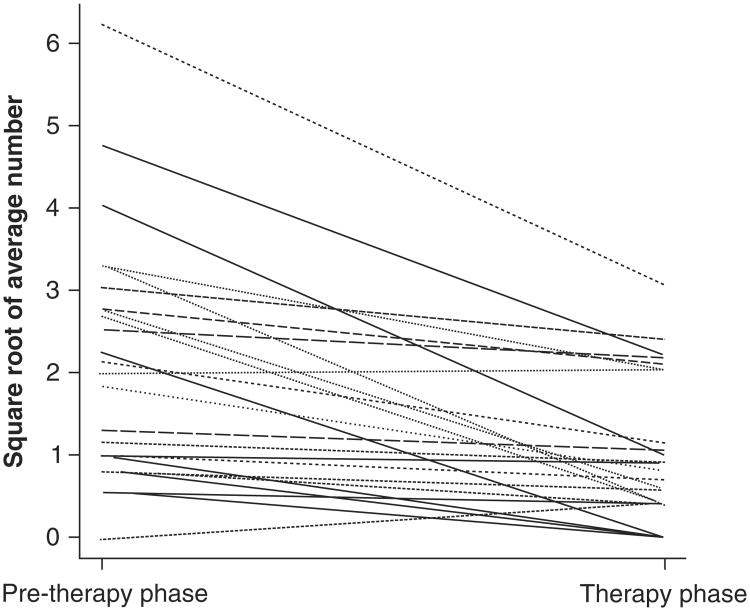
Methods: Thirty patients with relapsing-remitting (RR) MS were followed for a 3-month pre-therapy phase then for a 6-month therapy phase during which treatment with IFN-beta-1b at a dosage of 250 microg subcutaneously injected every other day was employed. Each patient underwent monthly clinical and MRI examinations. For all patients, CELs were identified on postcontrast T1-weighted MRIs. CEL number, size, and volume were computed using Medx software.
Results: The average number and total lesion volume of CELs visible during the therapy phase were significantly lower than the number and total lesion volume of CELs observed in the pre-therapy phase. However, there was no significant reduction between pre-therapy and therapy phases in the mean size of individual lesions arising during the respective phases.
Conclusions: Since size of CELs has been related to severity of tissue damage, the lack of size decrease during therapy suggested a limited therapeutic effect of IFN-beta-1b if a blood-brain barrier breakdown has occurred.
Conflict of interest statement
Figures


Similar articles
-
Interferon-beta-1b effects on re-enhancing lesions in patients with multiple sclerosis.Mult Scler. 2005 Dec;11(6):658-68. doi: 10.1191/1352458505ms1229oa. Mult Scler. 2005. PMID: 16320725 Clinical Trial.
-
Interferon beta-1b and intravenous methylprednisolone promote lesion recovery in multiple sclerosis.Mult Scler. 2001 Feb;7(1):49-58. doi: 10.1177/135245850100700109. Mult Scler. 2001. PMID: 11321194
-
An exploratory study on interferon beta dose effect in reducing size of enhancing lesions in multiple sclerosis.Mult Scler. 2007 Apr;13(3):343-7. doi: 10.1177/1352458506071172. Epub 2007 Jan 29. Mult Scler. 2007. PMID: 17439903 Clinical Trial.
-
Interferon beta treatment for multiple sclerosis: persisting questions.Mult Scler. 1996 Jul;1(6):321-4. doi: 10.1177/135245859600100605. Mult Scler. 1996. PMID: 9345408 Review.
-
Interferon-β-1b: a review of its use in multiple sclerosis.CNS Drugs. 2011 Jan;25(1):67-88. doi: 10.2165/11206430-000000000-00000. CNS Drugs. 2011. PMID: 21128695 Review.
Cited by
-
A Population Approach to Characterize Interferon Beta-1b Effect on Contrast Enhancing Lesions in Patients With Relapsing Remitting Multiple Sclerosis.CPT Pharmacometrics Syst Pharmacol. 2015 May;4(5):295-304. doi: 10.1002/psp4.36. Epub 2015 Apr 24. CPT Pharmacometrics Syst Pharmacol. 2015. PMID: 26225255 Free PMC article.
-
Population-Based Pharmacokinetic and Exposure-Efficacy Analyses of Peginterferon Beta-1a in Patients With Relapsing Multiple Sclerosis.J Clin Pharmacol. 2017 Aug;57(8):1005-1016. doi: 10.1002/jcph.883. Epub 2017 Apr 10. J Clin Pharmacol. 2017. PMID: 28394418 Free PMC article. Clinical Trial.
References
-
- McFarland HF, Frank JA, Albert PS, et al. Using gadolinium-enhanced magnetic resonance imaging lesions to monitor disease activity in multiple sclerosis. Ann Neurol. 1992;32:758–66. - PubMed
-
- Miller DH, Barkhof F, Nauta JJ. Gadolinium enhancement increases the sensitivity of MRI in detecting disease activity in multiple sclerosis. Brain. 1993;116:1077–94. - PubMed
-
- Bastianello S, Pozzilli C, Bernardi S, et al. Serial study of gadolinium-DTPA MRI enhancement in multiple sclerosis. Neurology. 1990;40:591–5. - PubMed
-
- Hawkins CP, Munro PM, MacKenzie F, et al. Duration and selectivity of blood-brain barrier breakdown in chronic relapsing experimental allergic encephalomyelitis studied by gadolinium-DTPA and protein markers. Brain. 1990;113:365–78. - PubMed
-
- Kermode AG, Thompson AJ, Tofts P, et al. Breakdown of the blood-brain barrier precedes symptoms and other MRI signs of new lesions in multiple sclerosis: pathogenetic and clinical implications. Brain. 1990;113:1477–89. - PubMed
Publication types
MeSH terms
Substances
Grants and funding
LinkOut - more resources
Full Text Sources
Other Literature Sources
Medical