. 2008 Nov 6:9:527.
doi: 10.1186/1471-2164-9-527.

Temporal and functional profile of the transcriptional regulatory network in the early regenerative response to partial hepatectomy in the rat

Affiliations

Temporal and functional profile of the transcriptional regulatory network in the early regenerative response to partial hepatectomy in the rat

Egle Juskeviciute et al. BMC Genomics. .

Abstract

Background: The goal of these studies was to characterize the transcriptional network regulating changes in gene expression in the remnant liver of the rat after 70% partial hepatectomy (PHx) during the early phase response including the transition of hepatocytes from the quiescent (G0) state and the onset of the G1 phase of the cell cycle.

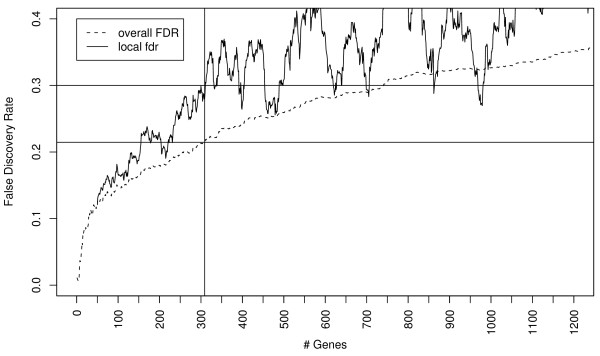
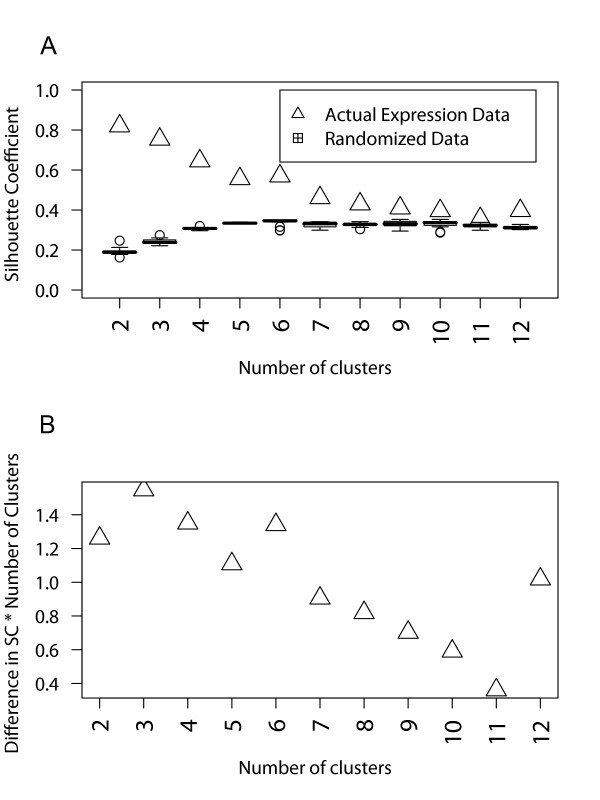
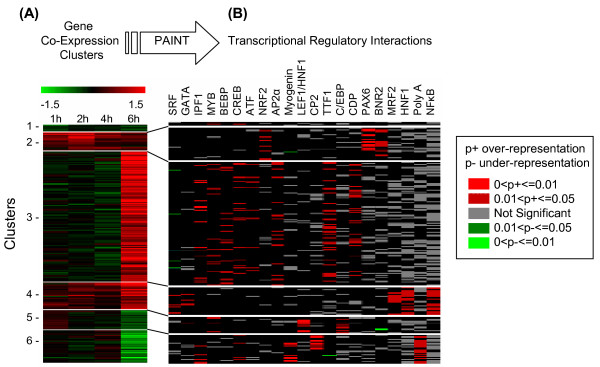
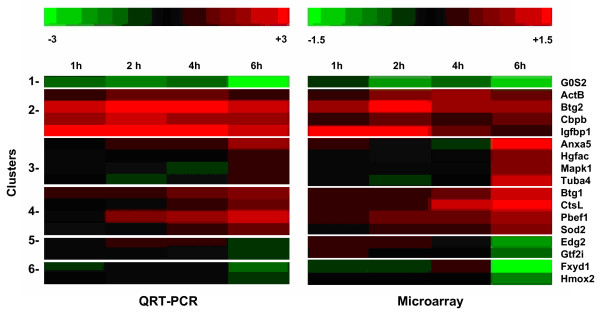
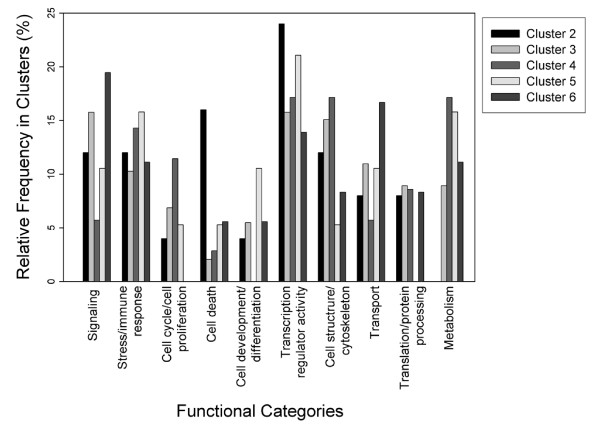
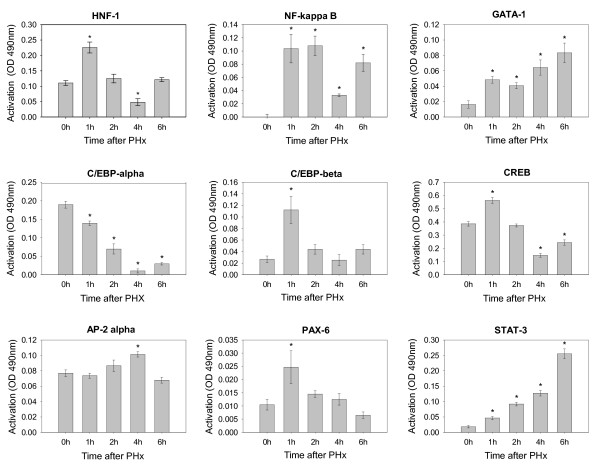
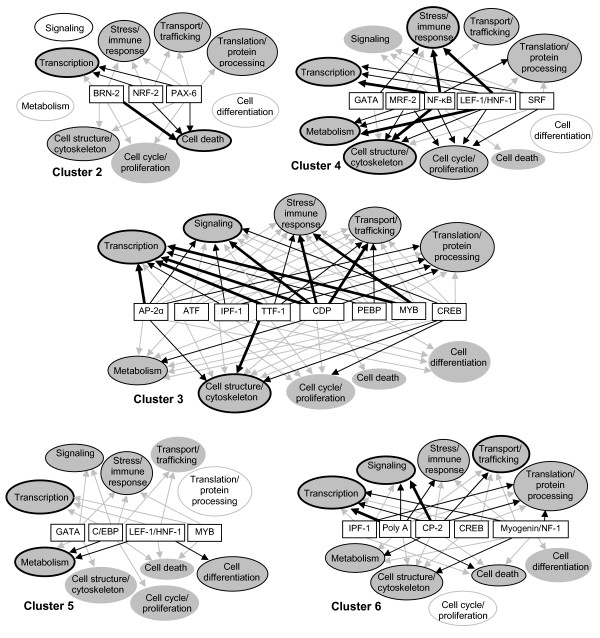
Results: The transcriptome of remnant livers was monitored at 1, 2, 4, and 6 hours after PHx using cDNA microarrays. Differentially regulated genes were grouped into six clusters according their temporal expression profiles. Promoter regions of genes in these clusters were examined for shared transcription factor binding sites (TFBS) by comparing enrichment of each TFBS relative to a reference set using the Promoter Analysis and Interaction Network Toolset (PAINT).Analysis of the gene expression time series data using ANOVA resulted in a total of 309 genes significantly up- or down-regulated at any of the four time points at a 20% FDR threshold. Sham-operated animals showed no significant differential expression. A subset of the differentially expressed genes was validated using quantitative RT-PCR. Distinct sets of TFBS could be identified that were significantly enriched in each one of the different temporal gene expression clusters. These included binding sites for transcription factors that had previously been recognized as contributing to the onset of regeneration, including NF-kappaB, C/EBP, HNF-1, CREB, as well as factors, such as ATF, AP-2, LEF-1, GATA and PAX-6, that had not yet been recognized to be involved in this process. A subset of these candidate TFBS was validated by measuring activation of corresponding transcription factors (HNF-1, NK-kappaB, CREB, C/EBP-alpha and C/EBP-beta, GATA-1, AP-2, PAX-6) in nuclear extracts from the remnant livers.

Conclusion: This analysis revealed multiple candidate transcription factors activated in the remnant livers, some known to be involved in the early phase of liver regeneration, and several not previously identified. The study describes the predominant temporal and functional elements to which these factors contribute and demonstrates the potential of this novel approach to define the functional correlates of the transcriptional regulatory network driving the early response to partial hepatectomy.


Figures

Figure 1
Figure 1
Relationship between overall FDR, local fdr, and the number of predicted differentially expressed genes. We chose a 30% local fdr as a threshold resulting in 309 differentially expressed genes (corresponding to a 21.4% overall FDR). Additional genes selected would be at a higher 'opportunity cost' as the local fdr is higher than 30% for the next 100 genes.
Figure 2
Figure 2
Assessment of the gene expression clustering results using the Computational Negative Control (CNC) approach. (A) For each specified number of clusters, the cluster quality metric, silhouette coefficient (SC), is evaluated and compared to that from the randomly permuted data. (B) Difference in SC from (A) multiplied by number of clusters shows a marked decrease at more than six clusters, indicating that SC is no longer distinct from the randomized data.
Figure 3
Figure 3
Analysis of gene expression time series data during the onset of liver regeneration. (A) Cluster analysis of the differential expression temporal profiles. The data was clustered using Partitioning Around Medoids using Pearson Correlation as the distance metric and with k = 6 (optimal number obtained from the results shown in Figure 1). Each row corresponds to a gene and each column corresponds to one of the four time points (1, 2, 4, 6 hours post partial hepatectomy). Lines demarcate the cluster boundaries. (B) The six clusters from (A) were analyzed for over-represented TF binding sites in the corresponding promoters using PAINT. The representative interaction matrix is shown. The rows represent the promoters and columns represent TFs. Each binding site for a TF on a promoter is marked red or grey, depending whether the frequency of that binding site in that cluster is statistically significantly overrepresented or not, respectively. Binding sites for several TFs known to be relevant in liver development and regeneration are enriched in distinct expression clusters. Lines indicate the mapping between the gene groups in the expression map and the corresponding promoter sets in the regulatory interaction matrix.
Figure 4
Figure 4
Comparison of QRT-PCR and cDNA microarray data on 17 genes differentially expressed at 1, 2, 4 or 6 h after partial hepatectomy (PHx). Each row corresponds to a gene and each column corresponds to one of the four time points (1, 2, 4, 6 hours post PHx). The lines demarcate the expression cluster boundaries. The clusters correspond to the data in Figure 3.
Figure 5
Figure 5
Distribution of gene functional categories in differentially expressed clusters. Bars correspond to the relative frequency of various gene functions in the differential expression clusters; the clusters are indicated with different fill patterns. Cluster 1 data were omitted in view of the small number of genes involved.
Figure 6
Figure 6
Activation of select transcription factors after partial hepatectomy. Transcription factor activation was monitored at different time points after PHx using TransAm NFκB p65, HNF-1, STAT-3, CREB, GATA family and C/EBP α/β kits (Active Motif, Carlsbad, CA) or TransFactor Universal Colorimetric Kit (Clontech, Mountain View, CA). In each case, 20–50 μg of nuclear extract was added per well with immobilized oligonucleotides based on the corresponding transcription factor binding site sequence. The primary antibodies were used to detect transcription factors bound to their target DNA. Addition of HRP-conjugated secondary antibody provided a colorimetric readout for quantification by spectrophotometry. At each time point, the data is normalized against a blank control sample. Error bars are based on replicate data from three animals.
Figure 7
Figure 7
Transcriptional regulatory networks of differentially expressed functional gene categories. Candidate transcription factors are shown in rectangular boxes and functional categories of genes are in ovals. The strength of the connections between TFs and functional gene categories are illustrated as arrows of different shade/thickness, corresponding to the number of genes in each functional category that have binding sites for specific TFs (grey, 1(2) genes; thin black, 2(3) – 3(4) genes; heavy black, >3(4) genes, numbers in parentheses refer to cluster 3 only). The shade/thickness of borders on the ovals represents the number of genes in that category relative to the total number of genes in the cluster (thick, >15%; thin, 10–15%; grey, <10%). Open ovals are categories not associated with any significantly enriched transcription factor binding site in that cluster. Cluster 1 was omitted in view of the small number of genes involved.

References

    1. Fausto N, Campbell JS, Riehle KJ. Liver regeneration. Hepatology. 2006;43:S45–53. - PubMed
    1. Taub R. Liver regeneration: from myth to mechanism. Nat Rev Mol Cell Biol. 2004;5:836–847. - PubMed
    1. Michalopoulos GK, DeFrances MC. Liver regeneration. Science. 1997;276:60–66. - PubMed
    1. Michalopoulos GK. Liver regeneration. J Cell Physiol. 2007;213:286–300. - PMC - PubMed
    1. Crumm S, Cofan M, Juskeviciute E, Hoek JB. Adenine nucleotide changes changes in the remnant liver: an early signal for regeneration after partial hepatectomy. Hepatology. 2008;48:898–908. - PMC - PubMed

Publication types

Substances

LinkOut - more resources