. 2008 Nov 6:9:528.
doi: 10.1186/1471-2164-9-528.

The transcriptomic signature of fasting murine liver

Affiliations

The transcriptomic signature of fasting murine liver

Milka Sokolović et al. BMC Genomics. .

Abstract

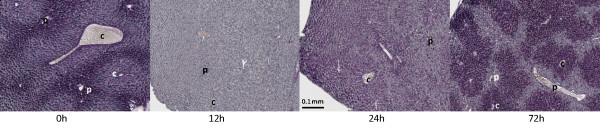
Background: The contribution of individual organs to the whole-body adaptive response to fasting has not been established. Hence, gene-expression profiling, pathway, network and gene-set enrichment analysis and immunohistochemistry were carried out on mouse liver after 0, 12, 24 and 72 hours of fasting.

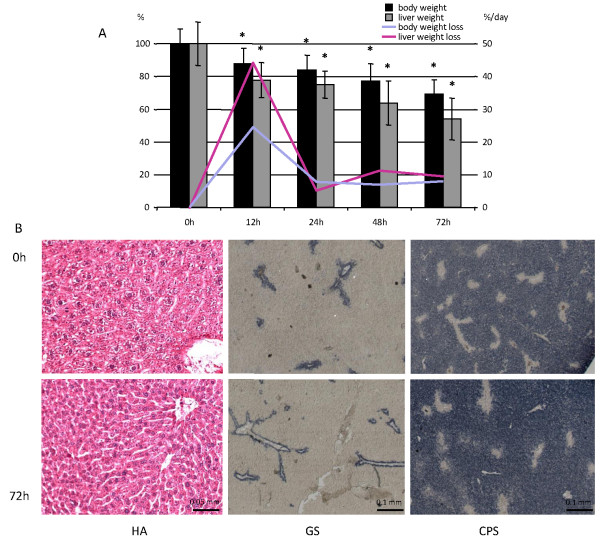
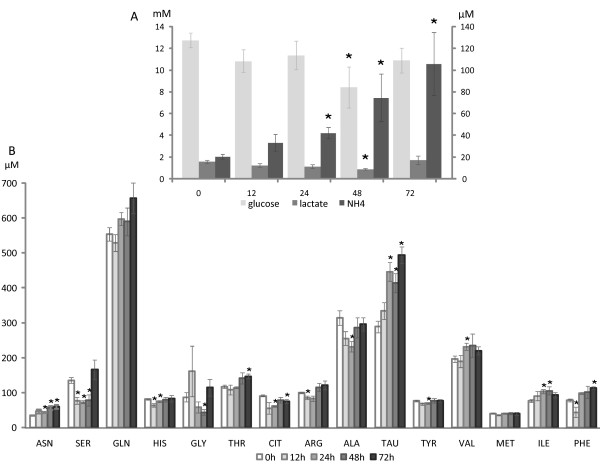
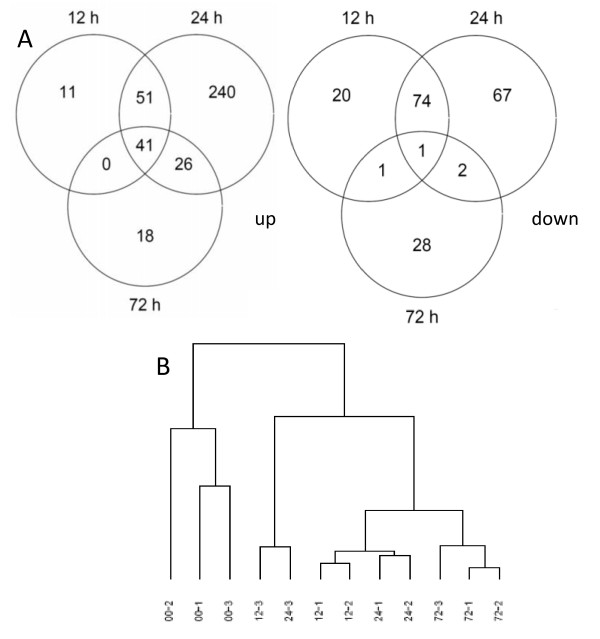
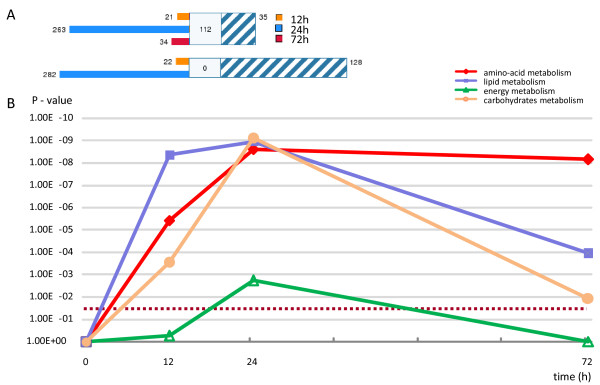
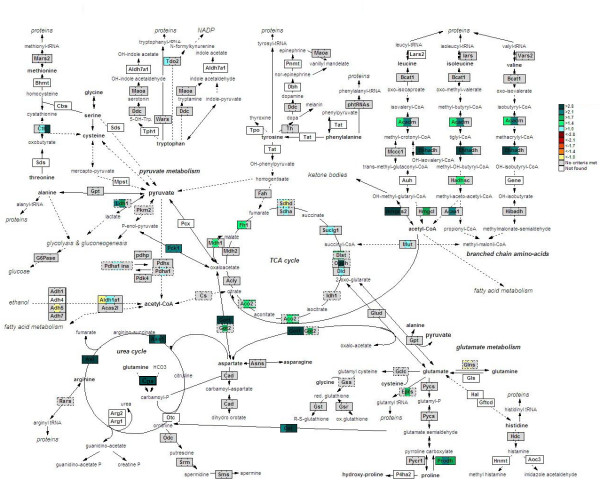
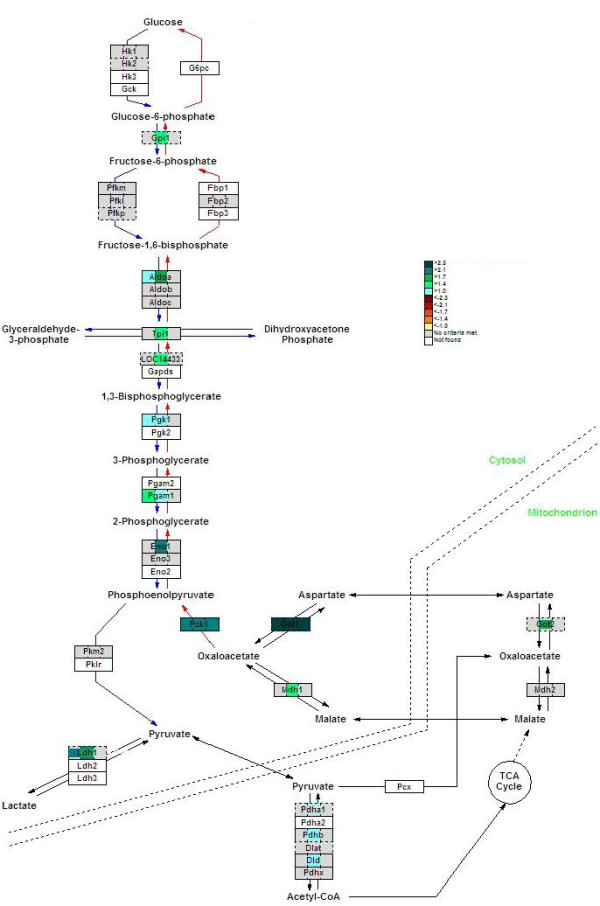
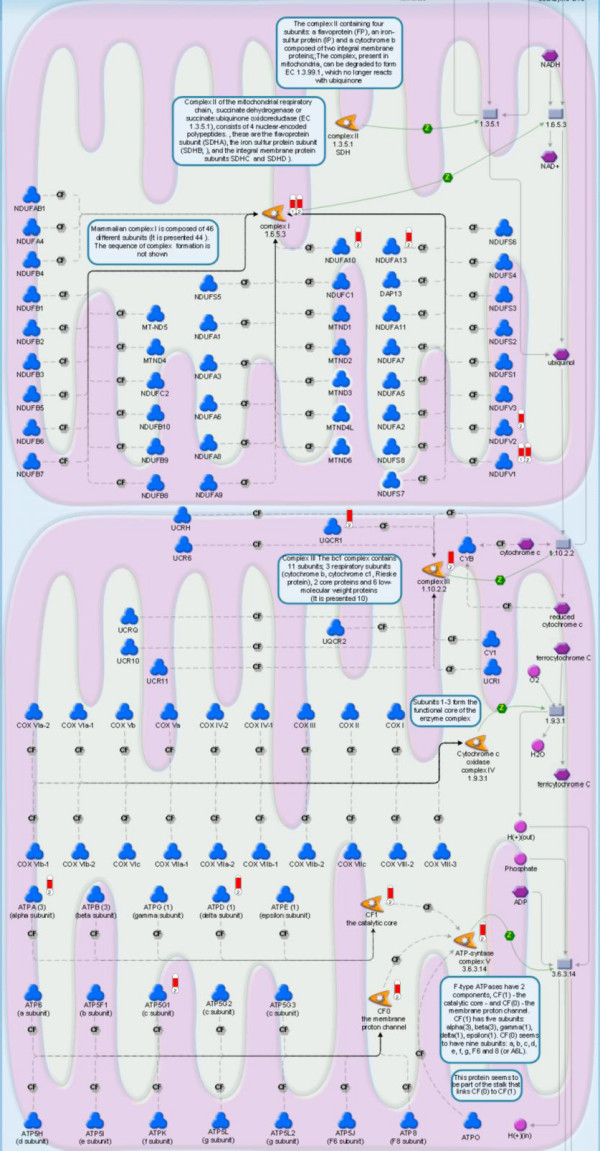
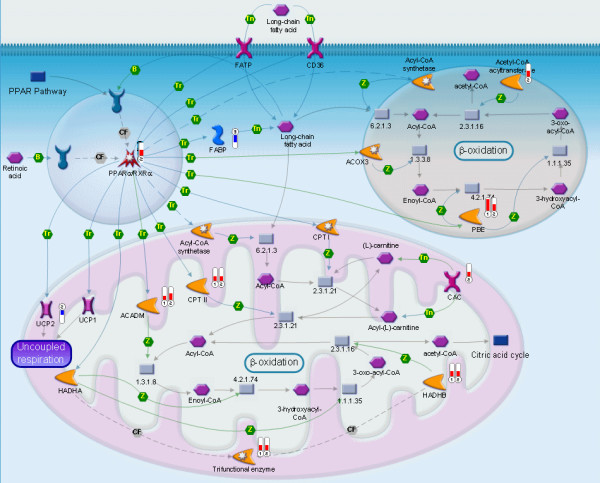
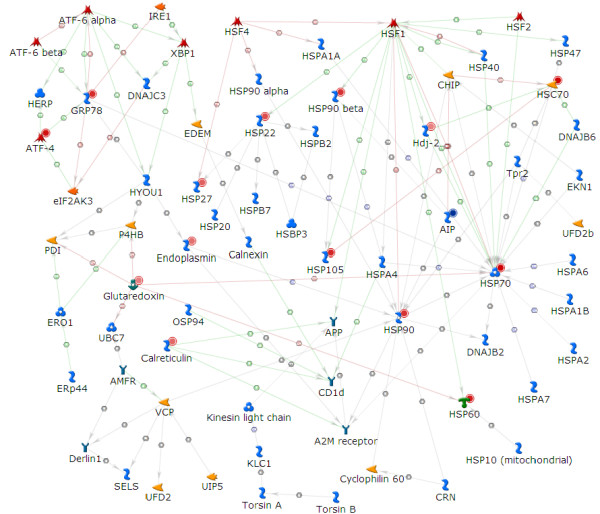
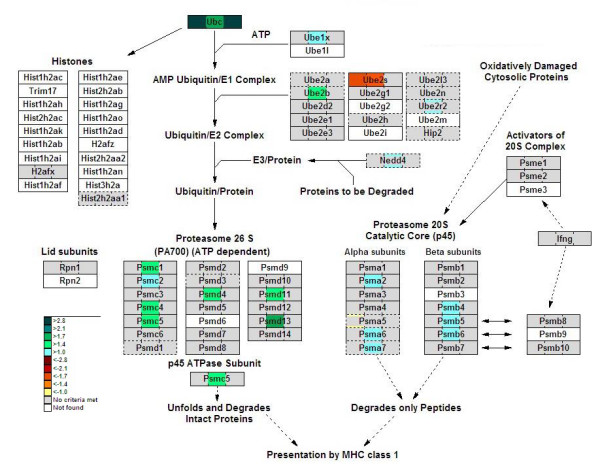
Results: Liver wet weight had declined approximately 44, approximately 5, approximately 11 and approximately 10% per day after 12, 24, 48 and 72 hours of fasting, respectively. Liver structure and metabolic zonation were preserved. Supervised hierarchical clustering showed separation between the fed, 12-24 h-fasted and 72 h-fasted conditions. Expression profiling and pathway analysis revealed that genes involved in amino-acid, lipid, carbohydrate and energy metabolism responded most significantly to fasting, that the response peaked at 24 hours, and had largely abated by 72 hours. The strong induction of the urea cycle, in combination with increased expression of enzymes of the tricarboxylic-acid cycle and oxidative phosphorylation, indicated a strong stimulation of amino-acid oxidation peaking at 24 hours. At this time point, fatty-acid oxidation and ketone-body formation were also induced. The induction of genes involved in the unfolded-protein response underscored the cell stress due to enhanced energy metabolism. The continuous high expression of enzymes of the urea cycle, malate-aspartate shuttle, and the gluconeogenic enzyme Pepck and the re-appearance of glycogen in the pericentral hepatocytes indicate that amino-acid oxidation yields to glucose and glycogen synthesis during prolonged fasting.

Conclusion: The changes in liver gene expression during fasting indicate that, in the mouse, energy production predominates during early fasting and that glucose production and glycogen synthesis become predominant during prolonged fasting.


Figures

Figure 1
Figure 1
Macro- and microscopic analysis of the fasting liver. A) Change in whole-body and liver weight during fasting as percentage of fed weight (n ≥ 8). Asterisks label significant changes (P < 0.01). The blue and pink lines represent the daily percentual change in body and liver weight, respectively, with the percent weight loss per day shown on the secondary y-axis. B) Histology of fed and 72 hour-starved livers (upper and lower panel, respectively). The sections were stained with hematoxylin and azophloxin (HA), and for the presence of glutamine synthetase (GS; pericentral expression) and carbamoylphosphate synthetase (CPS; periportal expression). The figures show that lobular architecture and metabolic zonation are unaffected by fasting. Bars: 0.1 mm.
Figure 2
Figure 2
Changes in plasma metabolite concentrations during fasting. A) Glucose and lactate (mM, primary Y-axis), and ammonia concentrations (μM, secondary Y-axis) after 0, 12, 24, 48 and 72 hours of fasting. B) Adaptive changes in concentrations of a selection of amino acids during fasting (those without significant change between any two time points were left out). For all the metabolites measured: 8 < n < 12; bars represent SEM and the asterisks identify significant changes (P < 0.05) in comparison to the fed condition.
Figure 3
Figure 3
Number of genes in the liver that are affected by fasting. A) Number of differentially expressed genes (≥ 1.4-fold change in expression; P < 0.01) at each time point studied. The left-sided Venn diagram shows the number of up-regulated and the right-sided diagram the number of down-regulated genes. Genes that were changed in expression at more than one time point are shown in the overlapping areas. B) Supervised hierarchical cluster based on correlation and complete linkage.
Figure 4
Figure 4
Adaptive changes in metabolic processes in the liver during fasting as analyzed by MetaCore™ software. A) The gene content imported to MetaCore™ is aligned between the time points. The parameters for comparison are ≥ 1.4 fold change and P < 0.01, and the annotation allowed for 56% of such genes to be linked. The unique genes changed at each of the time points are marked as colored bars (orange, blue and red for 12, 24 and 72 hours, respectively). The set of common genes, changed in all three conditions, is shown in blue-white hatching. The middle white box represents the similar genes (present in 2 out of 3 data points). The upper panel represents differentially regulated genes in all three time points of fasting, while the lower one shows uniquely and commonly differentially expressed genes for 12 and 24 hours of fasting. B) Four groups of metabolic processes changed significantly in response to fasting, with the response of all peaking at 24 hours. The Y-axis shows the significance of change, while the X-axis represents duration of fasting. The P-values of the pathways are calculated using the hypergeometric distribution, where the P-value represents the probability of a particular mapping arising by chance, given the numbers of genes in the set of all genes in pathways, genes in a particular pathway, and genes in the present experiment. The pathways are grouped into processes as defined in MetaCore™ (version 4.3, build 9787). The dotted line represents the 0.05 significance threshold.
Figure 5
Figure 5
Amino-acid catabolism in fasting liver. The map was created in the GenMAPP suite to show a comprehensive overview of amino-acid metabolism in response to fasting. Warm colors (from yellow to red) represent down-regulation, while cold colors (light blue to dark green) indicate an induction (see scale on the right border of the figure). Gray indicates no significant change. Genes not coupled to reporters on the array are shown in white. Genes represented by more than one sequence on the array are shown in dash-lined boxes, with the level of change depicted by the colored line surrounding the field. Each gene-box is split into 3 units, representing (from left to right) a change in expression after 12, 24 and 72 hours of fasting compared to fed animals.
Figure 6
Figure 6
Fasting upregulates genes of the malate-aspartate shuttle and the gluconeogenic enzyme Pepck1 in mouse liver. The color code of the GenMAPP view is the same as in Figure 5.
Figure 7
Figure 7
Electron-transport chain. Experimental data are visualized on a MetaCore map as blue (for downregulation) and red (upregulation) histograms ('thermometers'). The height of the histogram corresponds to the relative expression value for a particular gene, with numbers 1, 2 and 3 representing 12, 24 and 72 hours of fasting, respectively. A legend for the MetaCore™ canonical pathways is provided in Additional file 3.
Figure 8
Figure 8
PPARα regulation of lipid metabolism in fasting. The figure description is the same as in Figure 7.
Figure 9
Figure 9
Glycogen storage in mouse liver during fasting. In fed liver, periportal hepatocytes contain most glycogen (left panel). Twelve hours of fasting totally depletes the glycogen stores, but at 24 hours, glycogen starts to re-accumulate and has accumulated to high levels in pericentral hepatocytes after 72 hours of fasting (right panel). Portal and central veins are depicted by letters "p" and "c", respectively. Bar: 0.1 mm.
Figure 10
Figure 10
The unfolded-protein response in fasting. The network was generated and linked with available experimental data in the MetaCore™ suite. Nodes with red or blue circles in top right corner of the network objects, represent up- or down-regulation, respectively, with the shade indicating the intensity of the change. Detailed legend for MC networks is provided in Additional file 3.
Figure 11
Figure 11
Proteasome degradation in fasting. The colour code of the GenMAPP view is the same as in Figure 5.

References

    1. Le Maho Y, Vu Van Kha H, Koubi H, Dewasmes G, Girard J, Ferre P, Cagnard M. Body composition, energy expenditure, and plasma metabolites in long-term fasting geese. Am J Physiol. 1981;241:E342–E354. - PubMed
    1. Cherel Y, Attaix D, Rosolowska-Huszcz D, Belkhou R, Robin JP, Arnal M, Le MY. Whole-body and tissue protein synthesis during brief and prolonged fasting in the rat. Clin Sci (Lond) 1991;81:611–619. - PubMed
    1. Cherel Y, Le MY. Refeeding after the late increase in nitrogen excretion during prolonged fasting in the rat. Physiol Behav. 1991;50:345–349. doi: 10.1016/0031-9384(91)90076-Z. - DOI - PubMed
    1. Belkhou R, Cherel Y, Heitz A, Robin J, Le Maho Y. Energy contribution of proteins and lipids during prolonged fasting in the rat. Nutrition Research. 1991;11:365–374. doi: 10.1016/S0271-5317(05)80312-4. - DOI
    1. Habold C, Chevalier C, Dunel-Erb S, Foltzer-Jourdainne C, Le Maho Y, Lignot JH. Effects of fasting and refeeding on jejunal morphology and cellular activity in rats in relation to depletion of body stores. Scandinavian Journal of Gastroenterology. 2004;39:531–539. doi: 10.1080/00365520410004514. - DOI - PubMed

Publication types