

Detrended fluctuation analysis of intracranial pressure predicts outcome following traumatic brain injury
- PMID: 18990620
- PMCID: PMC2731428
- DOI: 10.1109/TBME.2008.2001286
Detrended fluctuation analysis of intracranial pressure predicts outcome following traumatic brain injury
Abstract
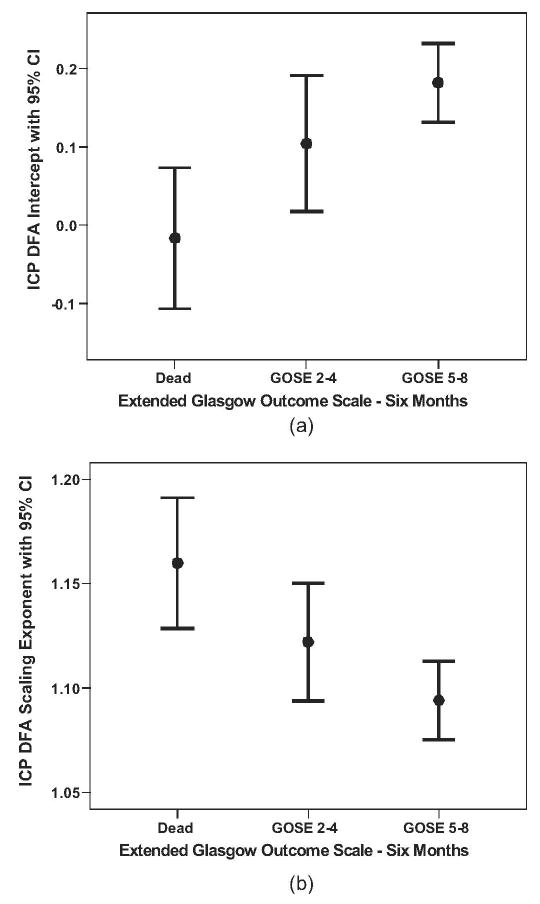
Detrended fluctuation analysis (DFA) is a recently developed technique suitable for describing scaling behavior of variability in physiological signals. The purpose of this study is to explore applicability of DFA methods to intracranial pressure (ICP) signals recorded in patients with traumatic brain injury (TBI). In addition to establishing the degree of fit of the power-law scaling model of detrended fluctuations of ICP in TBI patients, we also examined the relationship of DFA coefficients (scaling exponent and intercept) to: 1) measures of initial neurological functioning; 2) measures of functional outcome at six month follow-up; and 3) measures of outcome, controlling for patient characteristics, and initial neurological status. In a sample of 147 moderate-to-severely injured TBI patients, we found that a higher DFA scaling exponent is significantly associated with poorer initial neurological functioning, and that lower DFA intercept and higher DFA scaling exponent jointly predict poorer functional outcome at six month follow-up, even after statistical control for covariates reflecting initial neurological condition. DFA describes properties of ICP signal in TBI patients that are associated with both initial neurological condition and outcome at six months postinjury.
Figures


References
-
- Langlois JA, Rutland-Brown W, Thomas KE. Traumatic Brain Injury in the United States: Emergency Department Visits, Hospitalizations, and Deaths. Atlanta, GA: Centers for Disease Control and Prevention, National Center for Injury Prevention and Control; 2006.
-
- Chopp M, Portnoy HD. Systems analysis of intracranial pressure. Comparison with volume–pressure test and CSF-pulse amplitude analysis. J Neurosurg. 1980;53(4):516–527. - PubMed
-
- Lin ES, Poon W, Hutchinson RC, Oh TE. Systems analysis applied to intracranial pressure waveforms and correlation with clinical status in head injured patients. Brit J Anaesthesia. 1991;66(4):476–482. - PubMed
-
- Holm S, Eide PK. The frequency domain versus time domain methods for processing of intracranial pressure (ICP) signals. Med Eng Phys. 2008;30(2008):164–170. - PubMed
-
- Westhout FD, Pare LS, Delfino RJ, Cramer SC. Slope of the intracranial pressure waveform after traumatic brain injury. Surg Neurol. 2008;70(1):70–74. - PubMed
