. 2008 Dec 26;283(52):36344-53.
doi: 10.1074/jbc.M803580200. Epub 2008 Nov 6.

Glucose metabolism attenuates p53 and Puma-dependent cell death upon growth factor deprivation

Affiliations

Glucose metabolism attenuates p53 and Puma-dependent cell death upon growth factor deprivation

Yuxing Zhao et al. J Biol Chem. .

Abstract

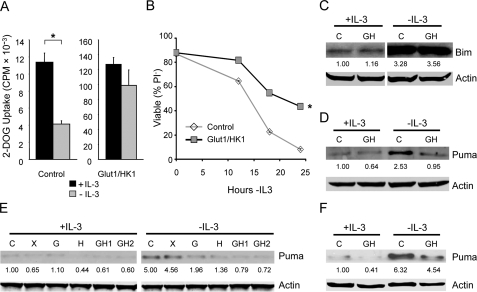
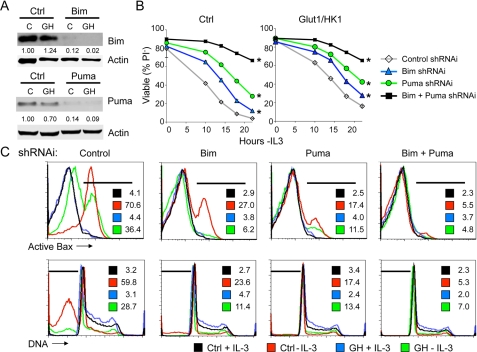
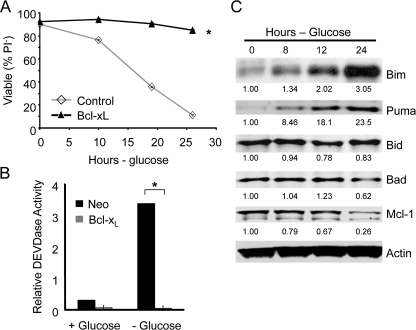
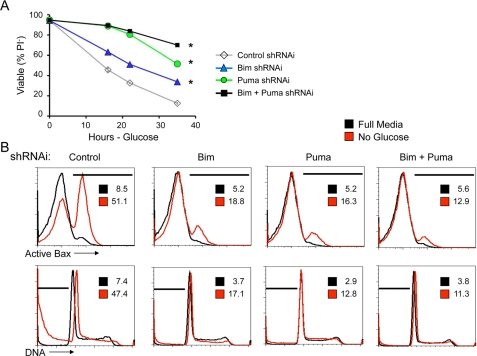
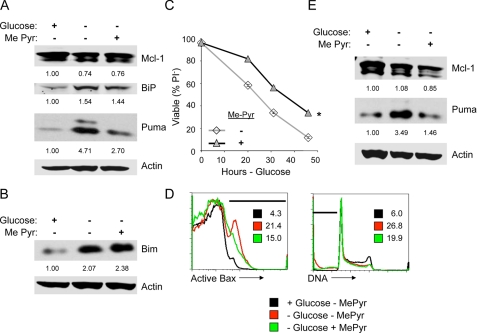
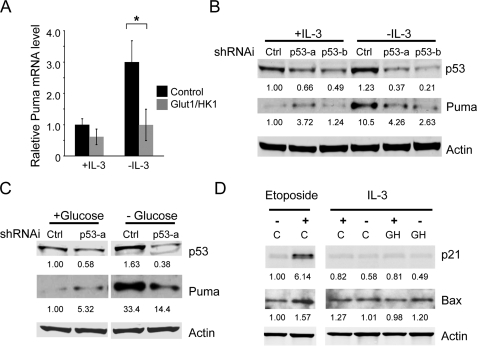
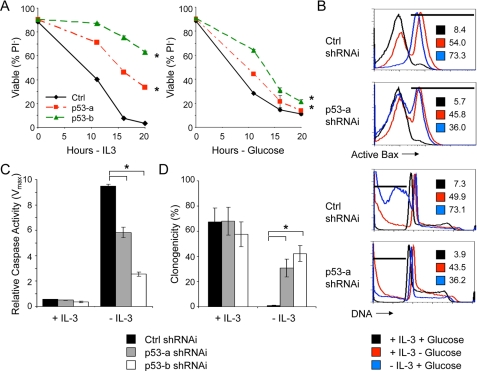
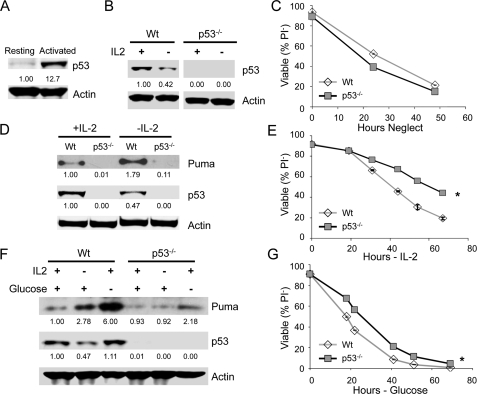
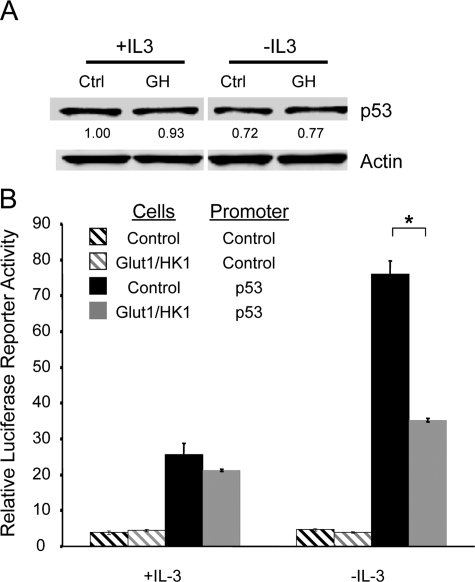
Growth factor stimulation and oncogenic transformation lead to increased glucose metabolism that may provide resistance to cell death. We have previously demonstrated that elevated glucose metabolism characteristic of stimulated or cancerous cells can stabilize the anti-apoptotic Bcl-2 family protein Mcl-1 through inhibition of GSK-3. Here we show that the pro-apoptotic Bcl-2 family protein, Puma, is also metabolically regulated. Growth factor deprivation led to the loss of glucose uptake and induction of Puma. Maintenance of glucose uptake after growth factor withdrawal by expression of the glucose transporter, Glut1, however, suppressed Puma up-regulation and attenuated growth factor withdrawal-induced activation of Bax, DNA fragmentation, and cell death. Conversely, glucose deprivation led to Puma induction even in the presence of growth factor. This regulation of Puma expression was a central component in cell death as a consequence of growth factor or glucose deprivation because Puma deficiency suppressed both of these cell death pathways. Puma induction in growth factor or glucose withdrawal was dependent on p53 in cell lines and in activated primary T lymphocytes because p53 deficiency suppressed Puma induction and delayed Bax and caspase activation, DNA fragmentation, and loss of clonogenic survival. Importantly, although p53 levels did not change or were slightly reduced, p53 activity was suppressed by elevated glucose metabolism to inhibit Puma induction after growth factor withdrawal. These data show that p53 is metabolically regulated and that glucose metabolism initiates a signaling mechanism to inhibit p53 activation and suppress Puma induction, thus promoting an anti-apoptotic balance to Bcl-2 family protein expression that supports cell survival.


Figures

FIGURE 1.
FIGURE 1.
Expression of Glut1 and HK1 attenuates growth factor withdrawal-induced Puma up-regulation. A, glucose uptake was measured in control and Glut1/HK1-expressing FL5.12 cells in the presence of IL-3 or after 10-h IL-3 withdrawal. B–D, control and Glut1/HK1 cells were cultured in the presence or absence of IL-3 and cell viability by propidium iodide uptake (B), and the levels of Bim (C) and Puma (D) proteins were determined. E and F, levels of Puma protein in independent FL5.12 clones (E) and 32D cells (F) were determined in the presence or absence of IL-3. lanes C, control; lanes G, Glut1; lanes H, HK1; lanes GH, Glut1/HK1; lanes X, Bcl-xL. The values are the means from triplicate samples, and the error bars indicate standard deviations. Statistical significance is shown by an asterisk to indicate Students t test p < 0.01 for cells with (+) and without (-) IL-3 (A) and for death curves (B) in which p < 0.01 for multiple time points for test samples relative to control samples.
FIGURE 2.
FIGURE 2.
Increased glucose metabolism depends on inhibition of Puma induction to attenuate cell death. A, control (lanes C) and Glut1/HK1 (lanes GH) cells were transfected with control (Ctrl), Bim (top panel), or Puma (bottom panel) shRNAi plasmid, and expression was determined 10 h after IL-3 withdrawal. B and C, cell viability was analyzed over time after IL-3 withdrawal by uptake of the vital dye PI (B) and after 15 h by flow cytometric analysis (C) for active conformation Bax (top row) and DNA fragmentation (bottom row). The percentage of cells in areas indicated by the bars are provided within each plot. The values are the means for cell survival from triplicate samples; error bars indicate standard deviations. Statistical significance is shown by an asterisk to indicate Students t test p < 0.01 for death curves with multiple time points for test samples relative to control samples.
FIGURE 3.
FIGURE 3.
Glucose deprivation leads to apoptosis and induction of Puma and Bim. A and B, control and Bcl-xL expressing cells were withdrawn from glucose and viability was measured by PI exclusion over time (A) and caspase 3 activity after 12 h (B). C, Bcl-xL expressing cells were analyzed by immunoblot over time after glucose withdrawal for expression of Bcl-2 family proteins. Statistical significance is shown by an asterisk to indicate Students t test p < 0.01 for death curves (A) in which p < 0.01 for multiple time points for test samples relative to control samples and for glucose uptake in cells with (+) and without (-) glucose (B).
FIGURE 4.
FIGURE 4.
Puma and Bim are essential for apoptosis following glucose withdrawal. A and B, control cells were transfected with control, Bim, Puma, or both Bim and Puma shRNAi and cell death after glucose withdrawal was observed over time by PI exclusion (A) and after 15 h by flow cytometry (B) for active conformation Bax (top row) and DNA fragmentation (bottom row). The percentages of cells in areas indicated by the bars are provided within each plot. The values are the means for cell survival from triplicate samples; the error bars indicate standard deviations. Statistical significance is shown by an asterisk to indicate Student's t test p < 0.01 for death curves with multiple time points for test samples relative to control samples.
FIGURE 5.
FIGURE 5.
Puma induction upon glucose withdrawal is suppressed by methyl-pyruvate. A–D, cells were cultured in glucose or withdrawn from glucose without or with addition of Me-Pyr. Puma (A) and Bim (B) expression were determined by immunoblot after 10 h, and cell survival was measured by propidium iodide exclusion over time (C) and after 12 h by flow cytometry (D) for active conformation Bax (left) and DNA fragmentation (right). The percentage of cells in areas indicated by bars are provided within each plot. E, primary T cells were isolated and stimulated in vitro on anti-CD3- and anti-CD28-coated plates for 2 days. Activated T cells were cultured in IL-2 in the presence of glucose or after glucose withdrawal without or with Me-Pyr for 1 day and analyzed by immunoblot. The values are the means for cell survival from triplicate samples, and error bars indicate standard deviations. Statistical significance is shown by an asterisk to indicate Student's t test p < 0.01 for death curves with multiple time points for test samples relative to control samples.
FIGURE 6.
FIGURE 6.
Puma is transcriptionally regulated by p53 in response to growth factor or glucose withdrawal. A, control and Glut1/HK1 cells were cultured in the presence or absence of IL-3 for 10 h. Total RNA was extracted, and levels of Puma mRNA were determined by quantitative real time PCR. B-D, cells were transfected with control (Ctrl) or independent p53 shRNAi plasmids (p53-a or p53-b), and p53 and Puma protein levels were determined after IL-3 (B) or glucose withdrawal (C). D, cells were untreated (vehicle only) or etoposide-treated or cultured in the presence or absence of IL-3 for 10 h, and p21 and Bax proteins were analyzed by immunoblot. Lanes C, control; lanes GH, Glut1/HK1. The values are the means from triplicate independent experiments, and error bars indicate standard deviations. Statistical significance is shown by an asterisk to indicate Students t test p < 0.01.
FIGURE 7.
FIGURE 7.
p53 is required for efficient growth factor or glucose withdrawal-induced apoptosis. Cells were transfected with control shRNAi or one of two independent p53 shRNAis. The cells were withdrawn from IL-3 or glucose, and cell viability was determined by propidium iodide exclusion over time (A) or flow cytometry (B) after 15 h for active conformation Bax (top two panels) and DNA fragmentation (bottom two panels). The percentages of cells in areas indicated by bars are provided within each plot. C and D, cells transfected with control (Ctrl) shRNAi or p53 shRNAis were cultured in IL-3 or withdrawn from IL-3 for 12 h, and caspase activity (C) and clonogenic survival (D) were determined. The values are the means (n = 3 for A and C; n = 6 for D), and error bars indicate standard deviations. Statistical significance is shown by an asterisk to indicate Student's t test p < 0.01 for cells with (+) and without (-) IL-3 (C and D) and for death curves (A) in which p < 0.01 for multiple time points for test samples relative to control samples.
FIGURE 8.
FIGURE 8.
p53 is required to induce Puma and promote efficient cell death after growth factor or glucose withdrawal in stimulated, but not resting, T cells. A, primary T cells were isolated, and p53 protein levels determined by immunoblot in resting T cells or T cells stimulated with anti-CD3 and anti-CD28 for 1 day. B, T cells from wild type (Wt) or p53-/- mice were stimulated as described in A; were cultured in IL-2 or deprived IL-2 and p53 levels determined by immunoblot. C, Wt and p53-/- T cells were purified and cultured without stimulation (neglect), and cell death was measured by propidium iodide exclusion over time. D and E, purified T cells from wild type and p53-/- mice were activated by CD3/CD28 for 2 days and cultured in the presence of IL-2 for additional 2 days. T cells were then washed and cultured in the presence or absence of IL-2. D, levels of Puma and p53 protein were determined after 24 h of additional culture. E, cell viability was analyzed by propidium iodide exclusion over time. F and G, primary T cells were stimulated as described above and cultured with or without IL2 or glucose. (F), Puma and p53 levels were observed by immunoblot after 1 day. (G), cell viability was observed by propidium iodide exclusion over time. The values are the means of triplicates, and error bars indicate standard deviations. Statistical significance is shown by an asterisk to indicate Student's t test p < 0.01 for death curves with multiple time points for test samples relative to control samples.
FIGURE 9.
FIGURE 9.
Increased glucose metabolism suppresses p53 activity in growth factor withdrawal. A, levels of p53 protein were determined by immunoblot in control (Ctrl) and Glut1/HK1 (GH) cells in the presence or absence of IL-3. B, activity of control luciferase reporter or p53 response element-driven luciferase reporter was determined in control and Glut1/HK1 cells in the presence of IL-3 or after 10 h withdrawal from IL-3. The values are the means of triplicates, and error bars indicate standard deviations.

References

    1. Plas, D. R., Rathmell, J. C., and Thompson, C. B. (2002) Nat. Immunol. 3 515-521 - PubMed
    1. Raff, M. C. (1992) Nature 356 397-400 - PubMed
    1. Gottlob, K., Majewski, N., Kennedy, S., Kandel, E., Robey, R. B., and Hay, N. (2001) Genes Dev. 15 1406-1418 - PMC - PubMed
    1. Plas, D. R., Talapatra, S., Edinger, A. L., Rathmell, J. C., and Thompson, C. B. (2001) J. Biol. Chem. 276 12041-12048 - PubMed
    1. Rathmell, J. C., Fox, C. J., Plas, D. R., Hammerman, P., Cinalli, R. M., and Thompson, C. B. (2003) Mol. Cell. Biol. 23 7315-7328 - PMC - PubMed

Publication types

MeSH terms

Substances