

doi: 10.1093/bioinformatics/btn578.
Epub 2008 Nov 5.
DNAPlotter: circular and linear interactive genome visualization
Affiliations
- PMID: 18990721
- PMCID: PMC2612626
- DOI: 10.1093/bioinformatics/btn578
Item in Clipboard
DNAPlotter: circular and linear interactive genome visualization
Bioinformatics.
.
Abstract
DNAPlotter is an interactive Java application for generating circular and linear representations of genomes. Making use of the Artemis libraries to provide a user-friendly method of loading in sequence files (EMBL, GenBank, GFF) as well as data from relational databases, it filters features of interest to display on separate user-definable tracks. It can be used to produce publication quality images for papers or web pages.
Availability: DNAPlotter is freely available (under a GPL licence) for download (for MacOSX, UNIX and Windows) at the Wellcome Trust Sanger Institute web sites: http://www.sanger.ac.uk/Software/Artemis/circular/
Figures
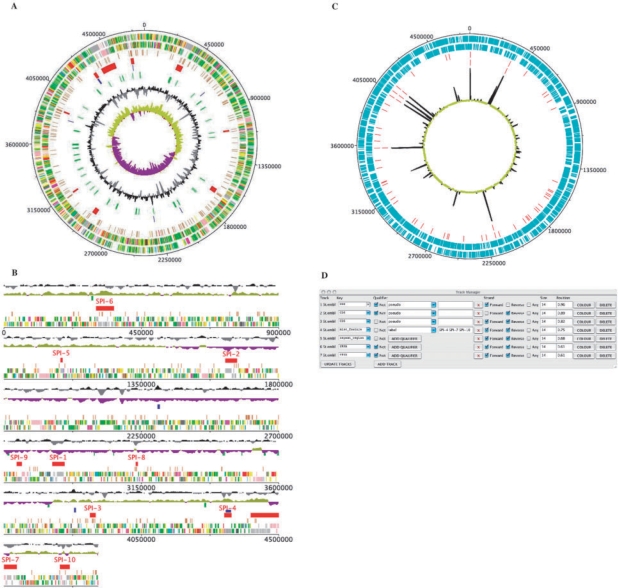
(A, B) showing Salmonella typhi genome as a circular and linear plot, respectively. The tracks from the outside represent: (1) Forward CDS; (2) Reverse CDS; (3) Pseudogenes 4. Salmonella Pathogenicity Islands (red); (5) repeat regions (blue); (6) rRNA and tRNA (green); (7) %GC plot 8. GC skew [(GC)/(G+C)]. (C) A generated example showing a transcriptome graph (black and yellow) on a circular plot for a prokaryotic genome. The tracks from the outside represent: (1) Forward CDS; (2) Reverse CDS; (3) tRNA; (4) rRNA. (D) Snapshot of the track manager showing filtering criteria.
References
-
- Berriman M, Rutherford K. Viewing and annotating sequence data with Artemis. Brief. Bioinform. 2003;4:124–132. - PubMed
-
- Gibson R, Smith DR. Genome visualization made fast and simple. Bioinformatics. 2003;19:1449–1450. - PubMed
-
- Kerkhoven R, et al. Visualization for genomics: the microbial genome viewer. Bioinformatics. 2004;20:1812–1814. - PubMed
-
- Pritchard L, et al. GenomeDiagram: a python package for the visualization of large-scale genomic data. Bioinformatics. 2006;22:616–617. - PubMed
Publication types
MeSH terms
Grants and funding
LinkOut - more resources
Full Text Sources
Molecular Biology Databases
