. 2009 Jan 1;25(1):75-82.
doi: 10.1093/bioinformatics/btn577. Epub 2008 Nov 5.

A novel signaling pathway impact analysis

Affiliations

A novel signaling pathway impact analysis

Adi Laurentiu Tarca et al. Bioinformatics. .

Abstract

Motivation: Gene expression class comparison studies may identify hundreds or thousands of genes as differentially expressed (DE) between sample groups. Gaining biological insight from the result of such experiments can be approached, for instance, by identifying the signaling pathways impacted by the observed changes. Most of the existing pathway analysis methods focus on either the number of DE genes observed in a given pathway (enrichment analysis methods), or on the correlation between the pathway genes and the class of the samples (functional class scoring methods). Both approaches treat the pathways as simple sets of genes, disregarding the complex gene interactions that these pathways are built to describe.

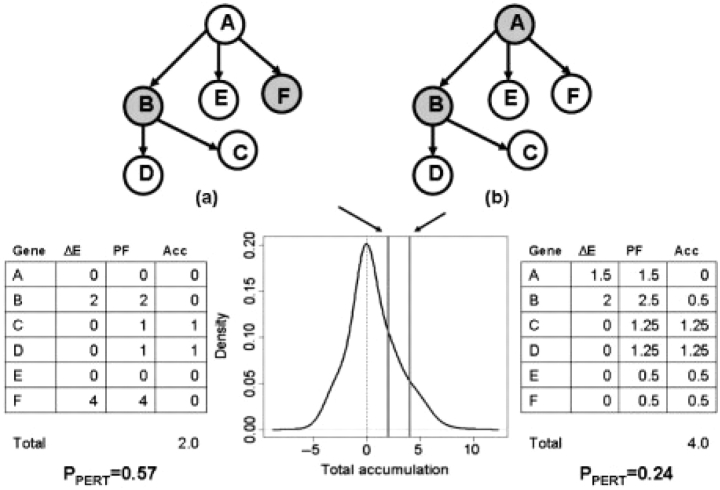
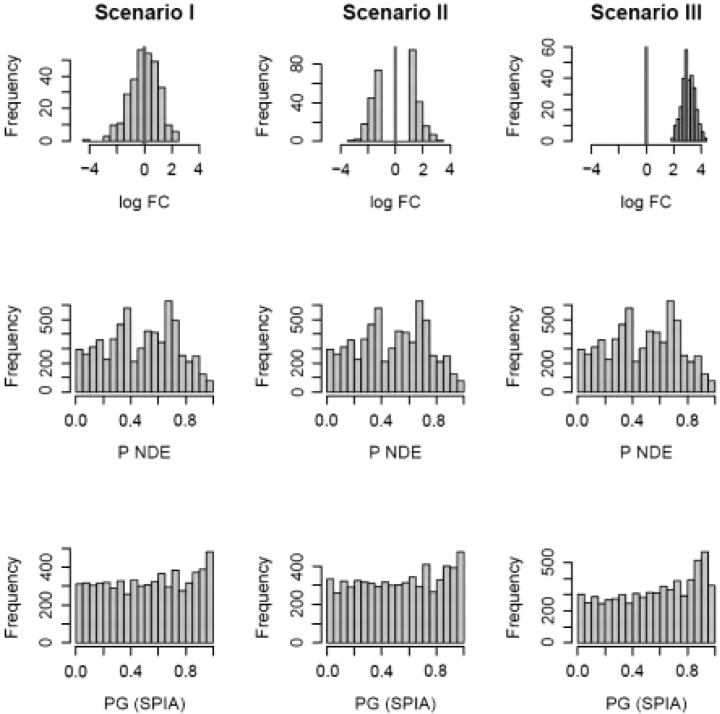
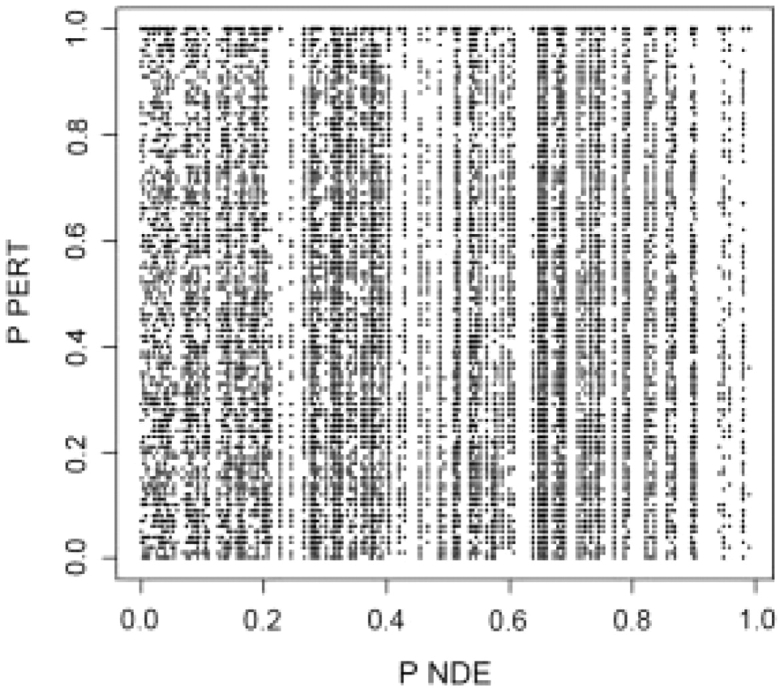
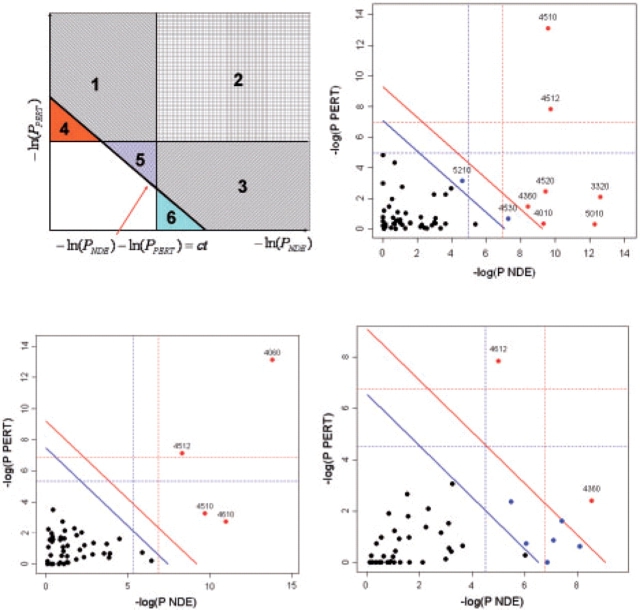
Results: We describe a novel signaling pathway impact analysis (SPIA) that combines the evidence obtained from the classical enrichment analysis with a novel type of evidence, which measures the actual perturbation on a given pathway under a given condition. A bootstrap procedure is used to assess the significance of the observed total pathway perturbation. Using simulations we show that the evidence derived from perturbations is independent of the pathway enrichment evidence. This allows us to calculate a global pathway significance P-value, which combines the enrichment and perturbation P-values. We illustrate the capabilities of the novel method on four real datasets. The results obtained on these data show that SPIA has better specificity and more sensitivity than several widely used pathway analysis methods.

Availability: SPIA was implemented as an R package available at http://vortex.cs.wayne.edu/ontoexpress/


Figures

Fig. 1.
Fig. 1.
Capturing the topology of the pathways and the position of the gene through the perturbation analysis. The figure shows a six-gene pathway with two DE genes (shown in gray) in two different situations. One of the two DE genes is in common (gene B) while the second gene is either a leaf node (a), or the entry point in the pathway (b). In (a), gene (F) cannot perturb the activity of other genes; in (b) gene (A) has the ability to influence the activity of all the remaining genes in the pathway, as the topology of the pathway indicates. An ORA would find the two situations equally (in)significant (PNDE=0.48 for a set of 20 monitored genes, out of which five are found to be DE). The perturbation evidence extracted by SPIA will give more significance to the situation in (b) (PPERT=0.24), even though fold-changes in (b) are almost twice as small as those in (a) (PPERT=0.57).
Fig. 2.
Fig. 2.
Distribution of P-values under three null distribution scenarios for the hypergeometric and SPIA models. Nde=300 gene IDs were selected at random out of 20 000 possible IDs containing all genes on all 52 pathways analyzed. The randomly selected gene IDs were assigned log fold-changes from (i) a random normal distribution N(0,1); (ii) a bimodal distribution obtained by sampling from the tails of a N(0,1) distribution; and (iii) random normal N(3,0.5). For each scenario, the experiment was repeated 200 times and PNDE, PPERT and PG were computed for all pathways receiving at least one DE gene. The resulting P-values for all pathways and all iterations were pooled together and shown as histograms for ORA (PNDE) and SPIA (PG) on rows 2 and 3, respectively. The false positives rates for SPIA at α = 5% were 4.7%, 5.0% and 4.6%, in scenarios I, II and III, respectively. For ORA, the same positive rates were 4.5% in all three scenarios. False positive rates as an average over these three scenarios are provided in Table 1 for several values of Nde.
Fig. 3.
Fig. 3.
Correlation analysis between PNDE and PPERT under the null hypothesis. This scatter-plot shows all pairs of P-values for 52 pathways, 200 random trials and the three fold-change distribution scenarios considered. As shown in Table 1, the squared correlation coefficient, R2, was less than 0.005, regardless of the number of genes analyzed, Nde. The current plot was obtained with Nde=300.
Fig. 4.
Fig. 4.
Two-dimensional plots illustrating the relationship between the two types of evidence considered by SPIA. The X-axis shows the over-representation evidence, while the Y-axis shows the perturbation evidence. In the top-left plot, areas 2, 3 and 6 together will include pathways that meet the over-representation criterion (PNDE<α). Areas 1, 2 and 4 together will include pathways that meet the perturbation criterion (PPERT<α). Areas 1, 2, 3 and 5 will include the pathways that meet the combined SPIA criteria (PG<α). Note how SPIA results are different from a mere logical operation between the two criteria (OR would be areas 1, 2, 3, 4 and 6; AND would be area 2). Interestingly, SPIA removes those pathways that are supported by evidence of any one single type that is just above their corresponding thresholds but not supported by the other type of evidence (areas 4 and 6), but adds pathways that are just under the individual significance thresholds but supported by both types of evidence (area 5). The other plots show the pathway analysis results on the Colorectal cancer (top right), LaborC (bottom left) and Vessels (bottom right) datasets. Each pathway is represented by a point. Pathways above the oblique red line are significant at 5% after Bonferroni correction, while those above the oblique blue line are significant at 5% after FDR correction. The vertical and horizontal thresholds represent the same corrections for the two types of evidence considered individually. Note that for the Colorectal cancer dataset (top right), the colorectal cancer pathway (ID=5210) is only significant according to the combined evidence but not so according to any individual evidence PNDE or PPERT.

Similar articles

Cited by

References

    1. Benjamini Y, Yekutieli D. The control of the false discovery rate in multiple testing under dependency. Ann. Stat. 2001;29:1165–1188.
    1. Bethin KE, et al. Microarray analysis of uterine gene expression in mouse and human pregnancy. Mol. Endocrinol. 2003;17:1454–1469. - PubMed
    1. Breuiller-Fouche M, Germain G. Gene and protein expression in the myometrium in pregnancy and labor. Reproduction. 2006;131:837–850. - PubMed
    1. Draghici S, et al. A systems biology approach for pathway level analysis. Genome Res. 2007;17:1537–1545. - PMC - PubMed
    1. Drăghici S. Statistical intelligence: effective analysis of high-density microarray data. Drug Discov. Today. 2002;7:S55–S63. - PubMed

Publication types