

An automated approach for estimation of breast density
- PMID: 18990749
- PMCID: PMC2705972
- DOI: 10.1158/1055-9965.EPI-08-0170
An automated approach for estimation of breast density
Abstract
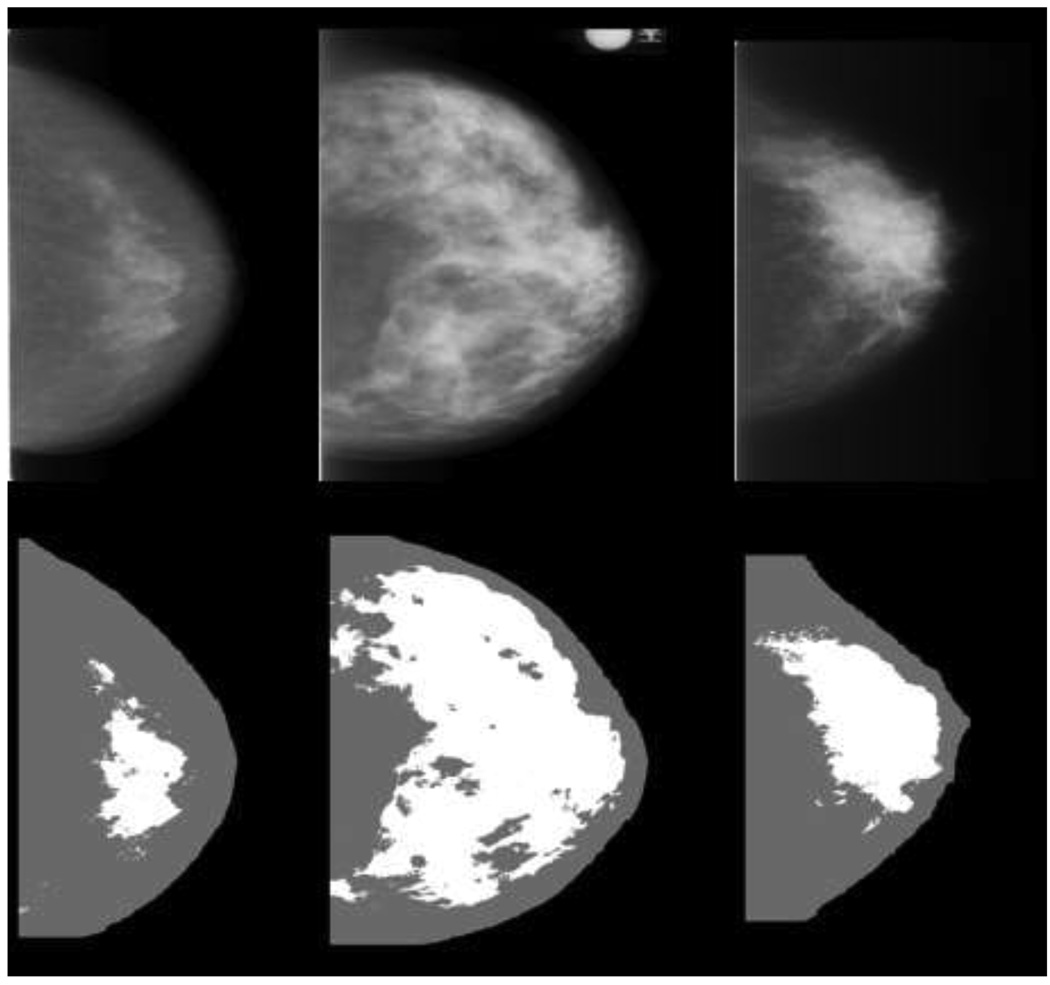
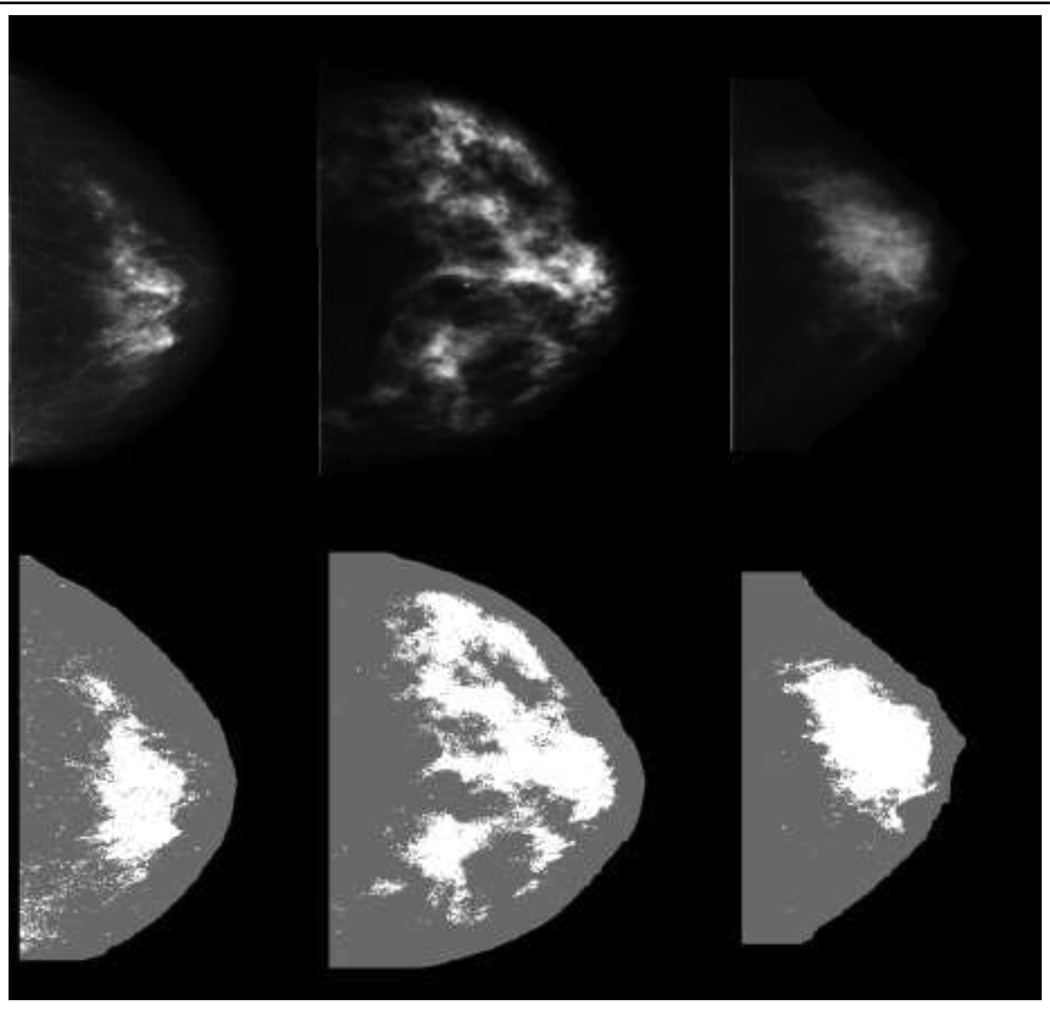
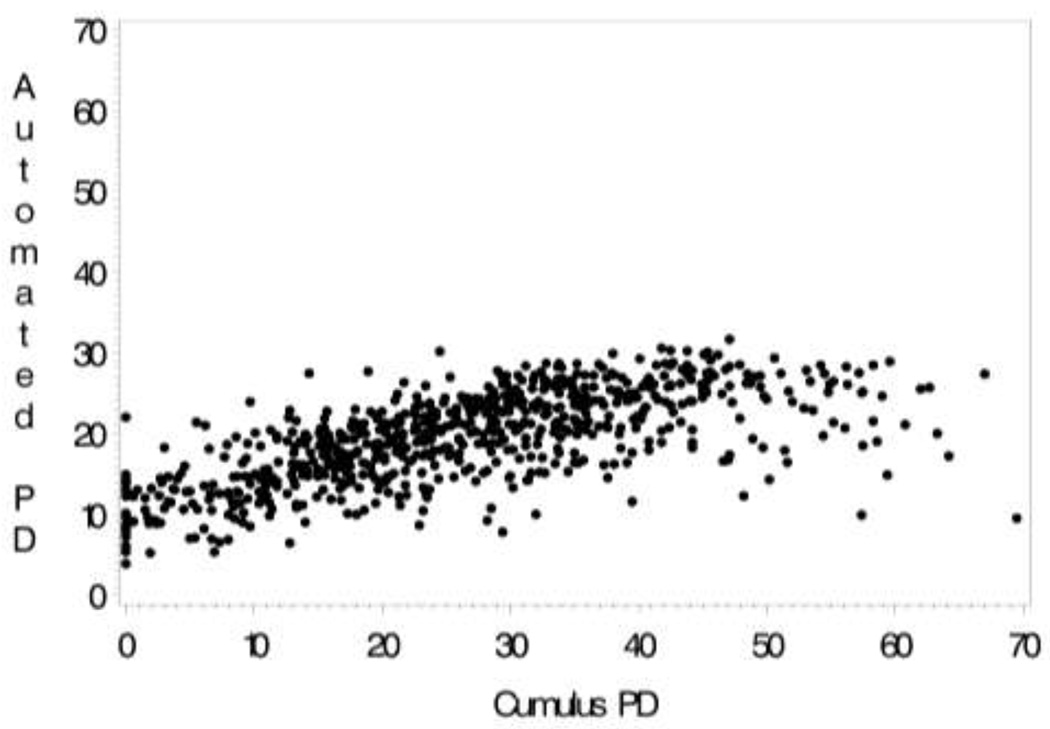
Breast density is a strong risk factor for breast cancer; however, no standard assessment method exists. An automated breast density method was modified and compared with a semi-automated, user-assisted thresholding method (Cumulus method) and the Breast Imaging Reporting and Data System four-category tissue composition measure for their ability to predict future breast cancer risk. The three estimation methods were evaluated in a matched breast cancer case-control (n = 372 and n = 713, respectively) study at the Mayo Clinic using digitized film mammograms. Mammograms from the craniocaudal view of the noncancerous breast were acquired on average 7 years before diagnosis. Two controls with no previous history of breast cancer from the screening practice were matched to each case on age, number of previous screening mammograms, final screening exam date, menopausal status at this date, interval between earliest and latest available mammograms, and residence. Both Pearson linear correlation (R) and Spearman rank correlation (r) coefficients were used for comparing the three methods as appropriate. Conditional logistic regression was used to estimate the risk for breast cancer (odds ratios and 95% confidence intervals) associated with the quartiles of percent breast density (automated breast density method, Cumulus method) or Breast Imaging Reporting and Data System categories. The area under the receiver operator characteristic curve was estimated and used to compare the discriminatory capabilities of each approach. The continuous measures (automated breast density method and Cumulus method) were highly correlated with each other (R = 0.70) but less with Breast Imaging Reporting and Data System (r = 0.49 for automated breast density method and r = 0.57 for Cumulus method). Risk estimates associated with the lowest to highest quartiles of automated breast density method were greater in magnitude [odds ratios: 1.0 (reference), 2.3, 3.0, 5.2; P trend < 0.001] than the corresponding quartiles for the Cumulus method [odds ratios: 1.0 (reference), 1.7, 2.1, and 3.8; P trend < 0.001] and Breast Imaging Reporting and Data System [odds ratios: 1.0 (reference), 1.6, 1.5, 2.6; P trend < 0.001] method. However, all methods similarly discriminated between case and control status; areas under the receiver operator characteristic curve were 0.64, 0.63, and 0.61 for automated breast density method, Cumulus method, and Breast Imaging Reporting and Data System, respectively. The automated breast density method is a viable option for quantitatively assessing breast density from digitized film mammograms.
Conflict of interest statement
No potential conflicts of interest were disclosed.
Figures
References
-
- McCormack VA, dos Santos Silva I. Breast density and parenchymal patterns as markers of breast cancer risk: a meta-analysis. Cancer Epidemiol Biomarkers Prev. 2006;15:1159–1169. - PubMed
-
- Couzin J. Breast cancer. Dissecting a hidden breast cancer risk. Science. 2005;309:1664–1666. - PubMed
-
- Byng JW, Boyd NF, Fishell E, Jong RA, Yaffe MJ. The quantitative analysis of mammographic densities. Phys Med Biol. 1994;39:1629–1638. - PubMed
-
- Byng JW, Yaffe MJ, Jong RA, et al. Analysis of mammographic density and breast cancer risk from digitized mammograms. Radiographics. 1998;18:1587–1598. - PubMed
-
- Boyd NF, Byng JW, Jong RA, et al. Quantitative classification of mammographic densities and breast cancer risk: results from the Canadian National Breast Screening Study. J Natl Cancer Inst. 1995;87:670–675. - PubMed
Publication types
MeSH terms
Grants and funding
LinkOut - more resources
Full Text Sources
Other Literature Sources
Medical
