. 2008 Nov;38(11):3015-27.
doi: 10.1002/eji.200838295.

Galectin-1 functions as a Th2 cytokine that selectively induces Th1 apoptosis and promotes Th2 function

Affiliations

Galectin-1 functions as a Th2 cytokine that selectively induces Th1 apoptosis and promotes Th2 function

Claudia C Motran et al. Eur J Immunol. 2008 Nov.

Abstract

Galectin-1 has been implicated in regulating T-cell survival, function, and Th1/Th2 balance in several mouse models, though the molecular and cellular basis of its immuno-modulatory activity has not been completely elucidated. Therefore, we examined galectin-1 expression and activity within differentiated murine Th1 and Th2 subsets. While recombinant galectin-1 specifically bound to both T-cell subsets, Th1 and Th2 T cells expressed distinct combinations of galectin-1-reactive epitopes and were differentially responsive to galectin-1 exposure. Indeed, Th1 cells were more susceptible to galectin-1-induced death than Th2 cells. Th2 protection from apoptosis was correlated with expression of anti-apoptotic galectin-3. Further, galectin-1 promoted TCR-induced type 2 cytokine production by Th2 cells. Differentiated Th2 cells constitutively expressed high levels of galectin-1 and can be induced to produce even higher levels of galectin-1 with restimulation, whereas comparable levels of galectin-1 in Th1 cells were only observed after restimulation. Co-culturing experiments using galectin-1(-/-) and galectin-1+/+ Th1 and Th2 T cells demonstrated that Th2-derived galectin-1 induced Th1 apoptosis, whereas Th1-derived galectin-1 promoted Th2 cytokine production. These studies identify galectin-1 as a cross-regulatory cytokine that selectively antagonizes Th1 survival, while promoting TCR-induced Th2 cytokine production.


Conflict of interest statement

Conflict of interest

The authors have no conflicting financial interests.

Figures
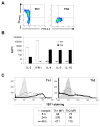
Figure 1
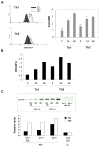
Figure 1. Th1 and Th2 effector populations differentiated from 5CC7 TCR transgenic mice
Th1 and Th2 cells were generated by two rounds of stimulation and cytokine skewing conditions as described in the Material and Methods. An equivalent number of cells were restimulated for 4 hours with plate bound anti-CD3 and soluble anti-CD28 in the presence of 1μl/ml GolgiStop. A) Density plots of IL-4 versus IFN-γ expression in the CD4+ gated population (>97% of the cells) of Th1 (left) and Th2 (right) differentiated cells. B) Mean cytokine levels of Th1 (open) and Th2 (filled) differentiated cell cultures restimulated with platebound anti-CD3 and soluble anti-CD28. Error bars represent standard deviations of triplicate samples per cytokine. Results are representative of at least four independent experiments. ND: not detectable. C) Histograms of stimulated Th1 (left) and Th2 (right) populations stained with the 1B11 antibody at 6 (thin line), 24 (dotted line), or 48 (thick line) hours, or isotype at 48 hours (filled). Results are typical of 2 experiments.
Figure 2
Figure 2. Th2 cells are more resistant to galectin-1 induced cell death than Th1 cells
Unstimulated differentiated Th1 or Th2 cells were incubated with recombinant galectin-1 (10 μM). A) Annexin V versus PI dot plots of Th1 or Th2 cells after 5 hours of exposure to recombinant galectin-1 or DTT control. Numbers shown in the bottom right of each plot indicate the percentage of cells in each corresponding quadrant. B) After recombinant galectin-1 exposure, unstimulated Th1 or Th2 cells were double-stained with FITC-labeled anti-CD4 and propidium iodide. Hypodiploid DNA content in CD4+ gated cells was assessed. The percentage of CD4+ cells in sub-G0/G1 as denoted by marker M1 is shown. C) Forward versus side scatter dot plots of unstimulated Th1 (top) or Th2 cells (bottom) in presence of DTT control (left), recombinant galectin-1 (middle), or galectin-1 plus 50 mM lactose (right). The percentage of cells in the gate is listed. Greater than 90% of Th1 and Th2 cells were FSClow resting cells prior to galectin-1 treatment. These graphs are representative of at least five individual experiments.
Figure 3
Figure 3. Binding of galectin-1 to differentiated Th1 and Th2 cells prior to and after TCR/CD28 restimulation
Flow histograms of Th1 (top) or Th2 (bottom) cells unstimulated (filled) or restimulated with anti-CD3/CD28 (thick line) and stained with biotin-galectin-1. Unstimulated cells stained with biotin-galectin-1 in the presence of 50 mM lactose (thin line) to ascertain carbohydrate-dependent binding or control isotype (dotted line) are also shown. M1 indicates the cells demonstrating high levels of galectin-1 binding. Histograms are representative of three individual experiments.
Figure 4
Figure 4. Galectin-1-mediated apoptosis does not rely on CD95-CD95L or TRAIL-TRAIL-R expression, though protection is correlated with galectin-3 expression
Th1 or Th2 populations were incubated for 5 hours with galectin-1 (10 μM) or DTT control. A) Percentage of recombinant galectin-1 (filled) or DTT control (open) treated Th1 (left) or Th2 (right) cells expressing CD95, CD95L and TRAIL. The illustrated plots are representative of three individual experiments yielding similar results. B) Galectin-3 mRNA expression in unstimulated, 24 hour, and 48 hour TCR/CD28 restimulated Th1 (left) and Th2 cells (right). Relative mRNA levels were quantitated by QPCR and measured in relative fluorescence units (RFU). Levels of gal-3 mRNA were normalized to mRNA levels of the L32 housekeeping gene and expressed as RFU/RFU. The graph is representative of two individual experiments. C) Fold increase of galectin-3 MFI in unstimulated Th1 (open) or Th2 (filled) cells relative to unstimulated Th1 cells. Relative MFI was calculated as: (Gal-3 MFI population − Isotype MFI population)/(Gal-3 MFI Th1 − Isotype MFI Th1). Results are representative of two independent experiments.
Figure 5
Figure 5. Galectin-1 antagonizes Th1- and promotes Th2- cytokine secretion
A) Mean IL-2 and IFN-γ levels in cultures of differentiated Th1 cells restimulated with anti-CD3/CD28 for 24 hours in the presence of 10 μM recombinant galectin-1 (filled) or DTT control (open). B) Mean IL-4, IL-5, IL-10, and IL-2 levels in cultures of differentiated Th2 cells restimulated with anti-CD3/CD28 for 24 hours in the presence of 10 μM recombinant galectin-1 (filled) or DTT control (open). For both parts A and B, error bars represent standard deviations of triplicate samples per cytokine, and results are representative of three independent experiments. The student’s t-test was used to determine if differences between cytokine levels of control versus rgal-1 treated cells were significant. * represents statistical significance, p< 0.05
Figure 6
Figure 6. Galectin-1 expression and secretion by Th1 and Th2 cells
A) Total galectin-1 protein staining on differentiated Th1 (top) or Th2 (bottom) cells after 0 (filled), 24 (thin line), or 48 (dotted line) hours of TCR/CD28 restimulation. Isotype control used was rabbit IgG; levels of isotype staining were low and similar at all points examined (not shown). A graphical representation showing the averaged results of single determinations from two independent experiments is also shown. Gal-1 expression is significantly higher in Th2 versus Th1 at the 0 (marked by **) and 24 hour (marked by *) time points. In both cases, p values < .001 as determined by the student’s t-test. Results are representative of 5 independent experiments. B) Galectin-1 mRNA expression in differentiated Th1 and Th2 cells after 0, 24 or 48 hours of TCR/CD28 restimulation. Gal-1 expression levels were measured in RFU and normalized to expression levels of the L32 housekeeping gene. The graph is representative of two individual experiments. C) Galectin-1 protein levels in supernatants of resting (NS = not stimulated) or restimulated differentiated Th1 (filled) or Th2 (open) cells at 24 or 48 hours. Serum free conditioned medium from galectin-1−/− Th1 or galectin-1−/− Th2 cells cultured for 24 hours served as negative controls. The position of monomeric (14.5 kDa) form of galectin-1 is shown on the left. The immunoreactive protein bands were quantified by densitometry and expressed as relative units (lower panel). The results are representative of two individual experiments.
Figure 7
Figure 7. Galectin-1 produced by Th2 cells binds Th1 cells and controls their survival
1×10⁶ galectin-1+/+ or −/− Th1 cells were labeled with CFSE and mixed with an equal number of galectin-1+/+or −/− Th2 cells in a 24 well plate and restimulated with anti-CD3/CD28 for 24 hours. A) Average MFI of galectin-1 staining observed on Th1 cells (CD4+CFSE + gated cells, left) or Th2 cells (CD4+CFSE gated cells, right) normalized to the MFI of galectin-1 staining obtained in the galectin−/− Th1plus galectin-1−/− Th2 co-culture. Normal rabbit IgG was used as isotype control of galectin-1 staining. Single determinations from a representative of four experiments are shown. B) The mean number of live galectin-1+/+ Th1 (CD4+CFSE+Annexin V− 7-AAD, left) or Th2 (CD4+CFSE Annexin V7-AAD, right) cells per well is shown for each stimulated co-culture combination. The error bars represent the standard deviations of duplicate values obtained in the same experiment. One representative of four experiments is shown. * represents statistical significance, p=0.03, as determined by the student’s t-test. C) Mean Th1- and Th2-type cytokine levels from supernatants of the stimulated mixed co-cultures were quantitated using ELISA. Error bars represent the standard deviations of triplicate samples. One representative of four experiments is shown. *p=0.01, as determined by the student’s t-test.

Similar articles

Cited by

References

    1. Abbas AK, Murphy KM, Sher A. Functional diversity of helper T lymphocytes. Nature. 1996;383:787–793. - PubMed
    1. Constant SL, Bottomly K. Induction of Th1 and Th2 CD4+ T cell responses: the alternative approaches. Annu Rev Immunol. 1997;15:297–322. - PubMed
    1. Glimcher LH, Murphy KM. Lineage commitment in the immune system: the T helper lymphocyte grows up. 10.1101/gad.14.14.1693. Genes & Dev. 2000;14:1693–1711. - PubMed
    1. Constant S, Pfeiffer C, Woodard A, Pasqualini T, Bottomly K. Extent of T cell receptor ligation can determine the functional differentiation of naive CD4+ T cells. J Exp Med. 1995;182:1591–1596. - PMC - PubMed
    1. Pfeiffer C, Stein J, Southwood S, Ketelaar H, Sette A, Bottomly K. Altered peptide ligands can control CD4 T lymphocyte differentiation in vivo. J Exp Med. 1995;181:1569–1574. - PMC - PubMed

Publication types

LinkOut - more resources