. 2008 Dec 2;24(23):13399-405.
doi: 10.1021/la802097z.

Effect of fluorescently labeling protein probes on kinetics of protein-ligand reactions

Affiliations

Effect of fluorescently labeling protein probes on kinetics of protein-ligand reactions

Y S Sun et al. Langmuir. .

Abstract

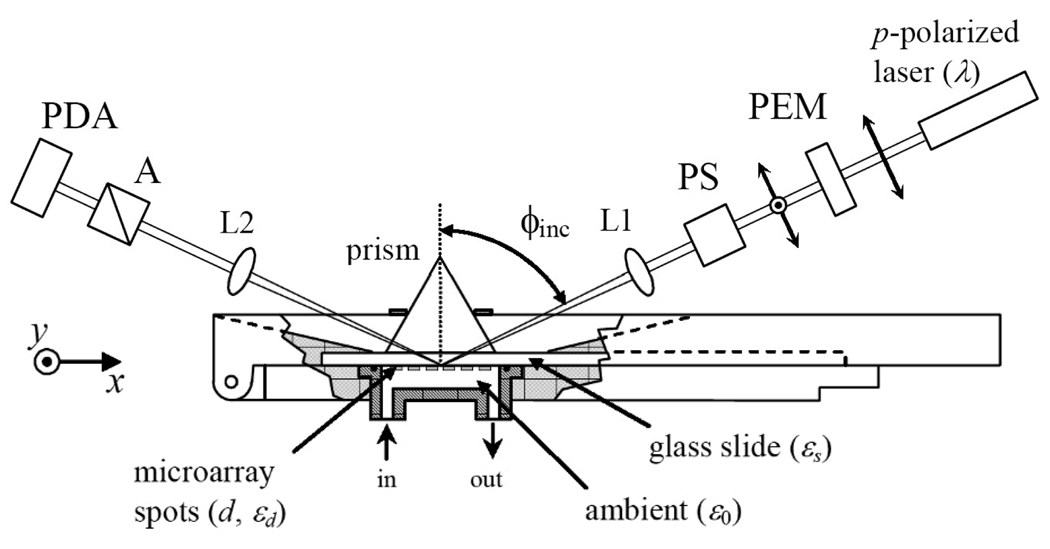
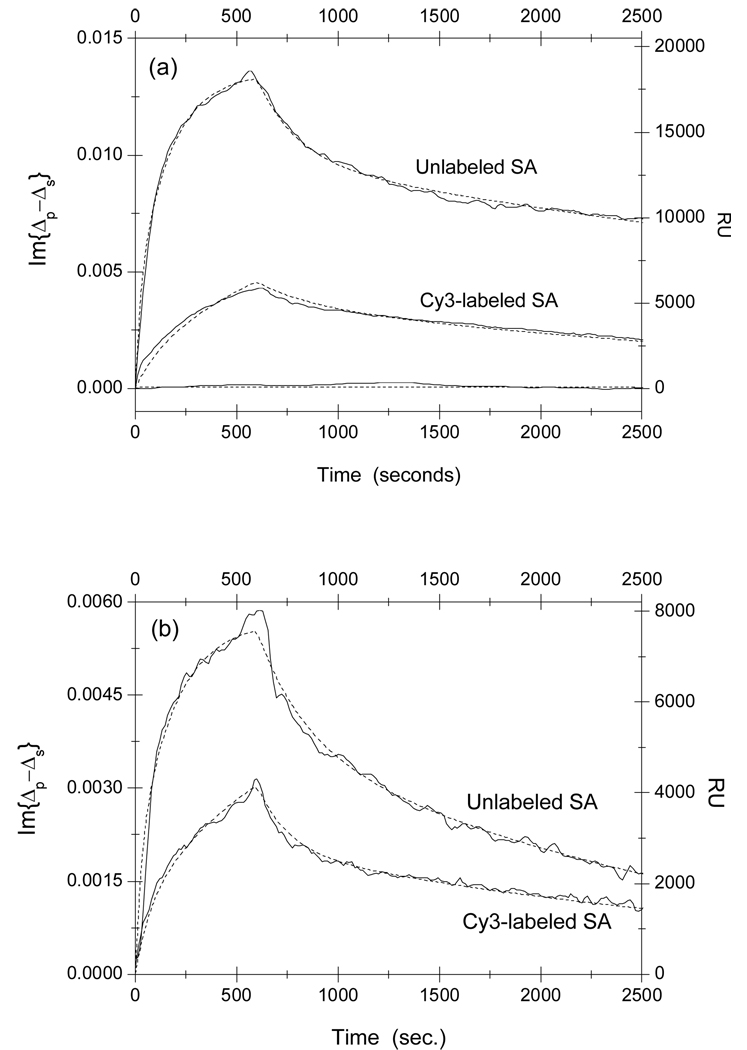
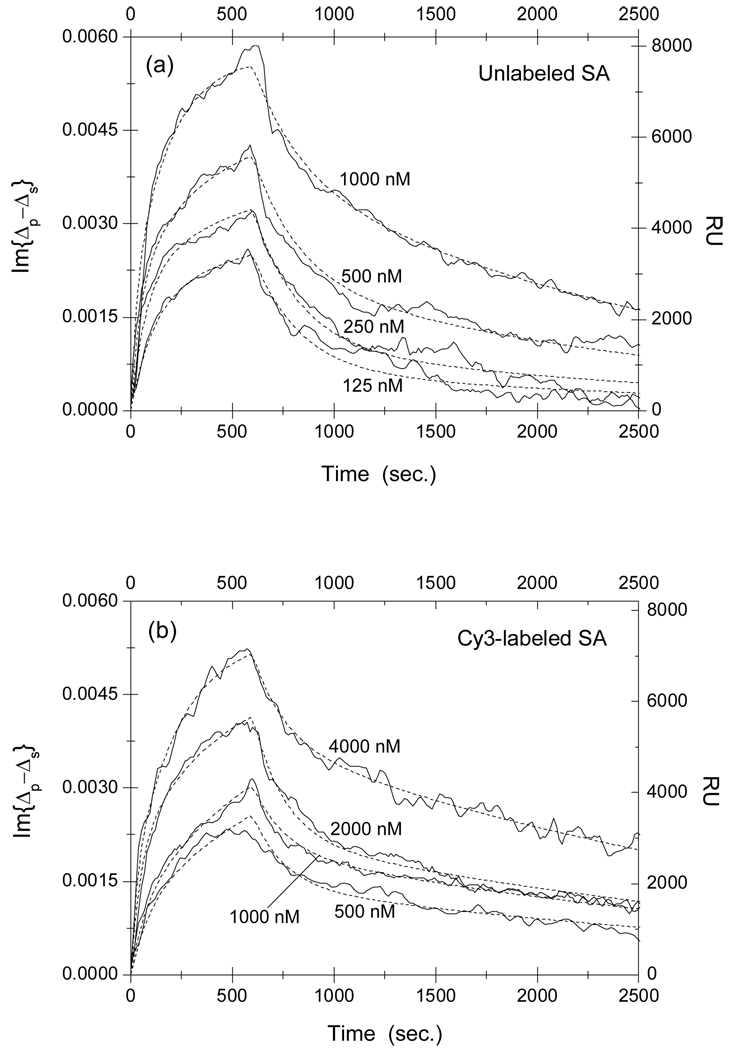
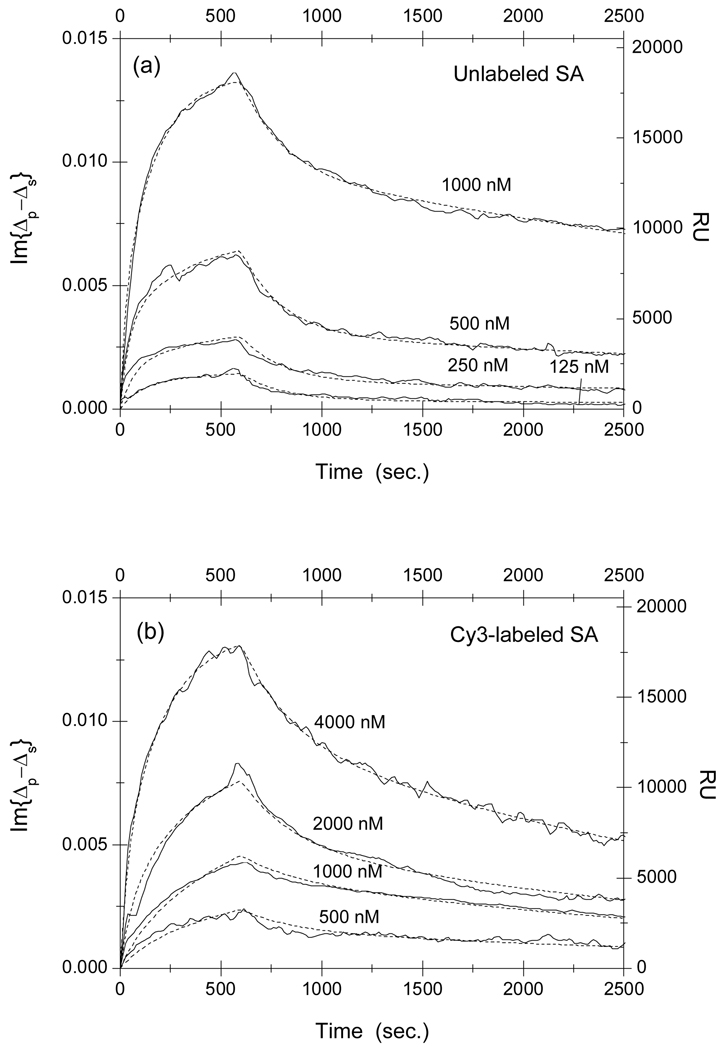
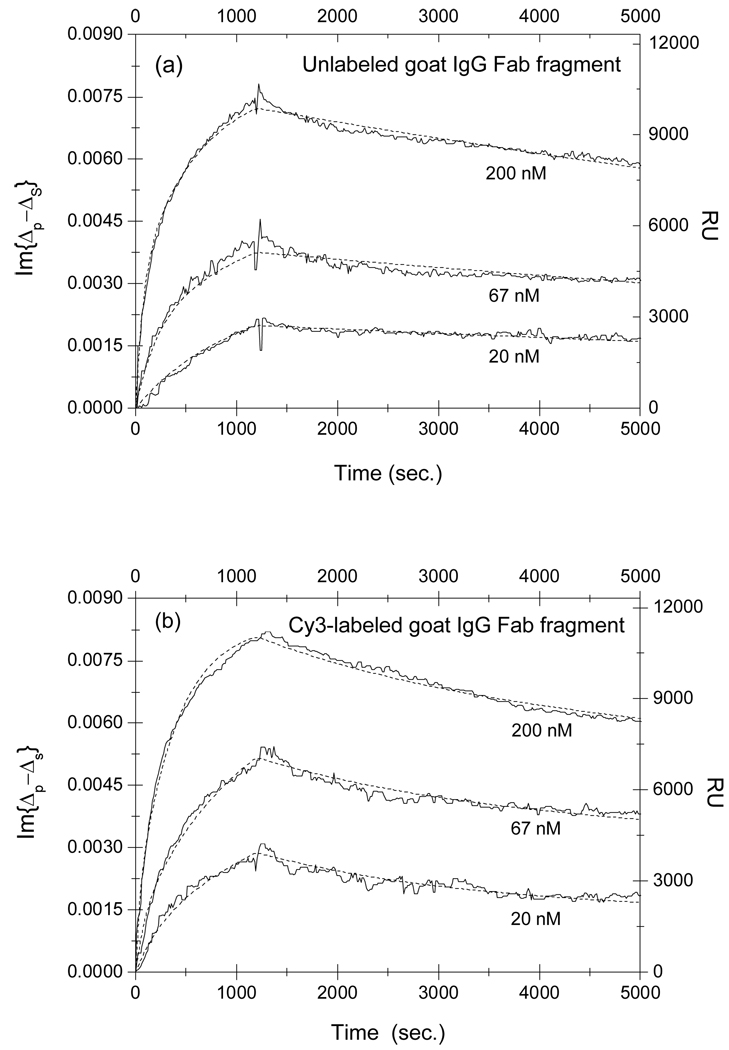
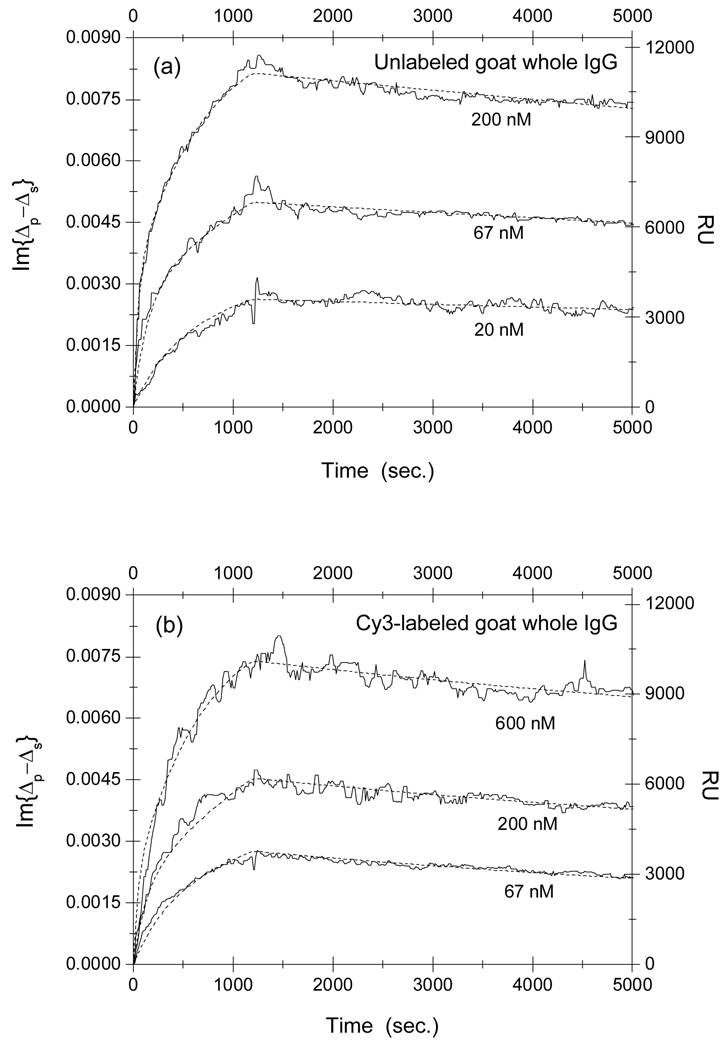
We studied the effect of fluorescently labeling proteins on protein-ligand reactions. Unlabeled ligands (streptavidin-binding peptides and rabbit immunoglobulin G (IgG) as antigen targets) are immobilized on epoxy-functionalized glass slides. Unlabeled and Cy3-labeled protein probes from the same batch (streptavidin and goat antibodies) subsequently react with the surface-immobilized targets. By monitoring in situ the surface mass density change using an oblique-incidence reflectivity difference scanning microscope (a label-free detector), we measured k(on) and k(off) for streptavidin-peptide reactions and antibody-antigen reaction. We found that (1) equilibrium dissociation constants, defined as K(D) = k(off)/k(on), for streptavidin-peptide reactions increases by a factor of 3-4 when the solution-phase streptavidin is labeled with Cy3 dye and (2) K(D) for reactions of solution-phase goat anti-rabbit antibodies with rabbit IgG targets also change significantly when the goat antibodies are labeled with Cy3 dye.


Figures

Fig. 1
Fig. 1
Sketch of an oblique-incidence reflectivity difference (OI-RD) scanning microscope for detection of association and dissociation of solution-phase protein with ligand microarrays immobilized on a glass slide surface. It employs the total internal reflection geometry for illumination and a combination of a 152-element photodiode array (PDA) for y-scan and a mechanical translation stage for x-scan. PEM: photoelastic modulator that changes the polarization of the illumination laser beam at 50 kHz. PS: variable phase-shifter. L1: cylindrical lens that focuses the illumination laser beam to a line segment on the sample surface. L2: 10× Objective lens that forms an enlarged image of the illuminated line segment across PDA. A: polarization analyzer.
Fig. 2
Fig. 2
Real-time association-dissociation curves of solution-phase streptavidin (SA) with immobilized peptide-BSA conjugates on an epoxy-coated glass slide. The concentration of streptavidin is 1 µM in both measurements. Panel (a): reactions of streptavidin with linear SAWSHPQFEK-BSA conjugates. The curve near zero is the association-dissociation curve of streptavidin with a BSA control spot, which shows no evidence of non-specific reaction between BSA and streptavidin. Panel (b): reactions of streptavidin with disulfide-bridged cyclic CHPQGPPC-BSA. The optical signal Im{Δp–Δs} is related to the captured streptavidin through Eq. (2) and Eq. (4).
Fig. 3
Fig. 3
Association-dissociation curves of (a) unlabeled and (b) Cy3-labeled streptavidin with surface-immobilized linear SAWSHPQFEK-BSA conjugates at different streptavidin concentrations. It should be noted that the probe concentrations in Part (b) are 4 times larger than those in Part (a). The curves are globally fitted (dot lines) to a two-site Langmuir reaction model (see main text for details) with the global fitting parameters listed in Table 1.
Fig. 4
Fig. 4
Association-dissociation curves of (a) unlabeled and (b) Cy3-labeled streptavidin with surface-immobilized disulfide-bridged cyclic CHPQGPPC-BSA conjugates at different streptavidin concentrations. It should be noted that the probe concentrations in Part (b) are 4 times larger than those in Part (a). The dot lines are global fits to a two-site Langmuir reaction model (see main text for details) with the global fitting parameters listed in Table 2.
Fig. 5
Fig. 5
Association-dissociation curves of (a) unlabeled and (b) Cy3-labeled monovalent Fab fragment of goat IgG against the (H+L) domain of rabbit IgG with surface-immobilized rabbit IgG at different goat IgG concentrations. The curves are globally fitted (dot lines) to a two-site Langmuir reaction model (see main text for details) with the global fitting parameters listed in Table 3.
Fig. 6
Fig. 6
Association-dissociation curves of (a) unlabeled and (b) Cy3-labeled goat anti-rabbit whole IgG against the Fc domain of rabbit IgG with surface-immobilized rabbit IgG at different goat IgG concentrations. The dot lines are global fits to a two-site Langmuir reaction model (see main text for details) with the global fitting parameters listed in Table 4.

References

    1. Schena M. Microarray Analysis. Hoboken: John Wiley and Sons; 2003.
    1. Zhu H, Bilgin M, Bangham R, Hall D, Casamayor A, Bertone P, Lan N, Jansen R, Bidlingmaier S, Moufek T, Mitchell T, Miller P, Dean RA, Gerstein M, Snyder M. Science. 2001;293:2101–2105. - PubMed
    1. MacBeath G. Nature Genet. 2002;32:526–532. - PubMed
    1. Kodadek T. Chem. Biol. 2001;8:105–115. - PubMed
    1. Quake S. private communication

Publication types