Gamma/Delta T cell mRNA levels decrease at mucosal sites and increase at lymphoid sites following an oral SIV infection of macaques
- PMID: 18991617
- PMCID: PMC2777980
- DOI: 10.2174/157016208786501490
Gamma/Delta T cell mRNA levels decrease at mucosal sites and increase at lymphoid sites following an oral SIV infection of macaques
Abstract
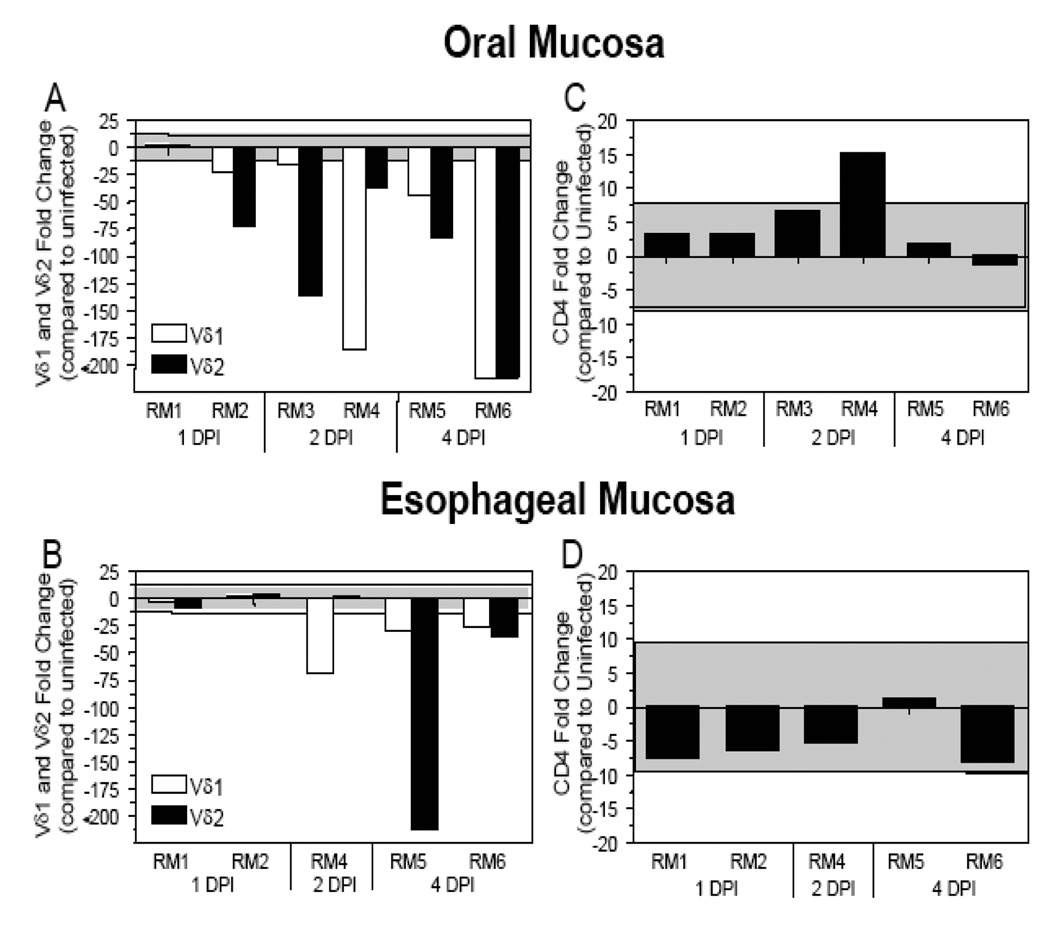
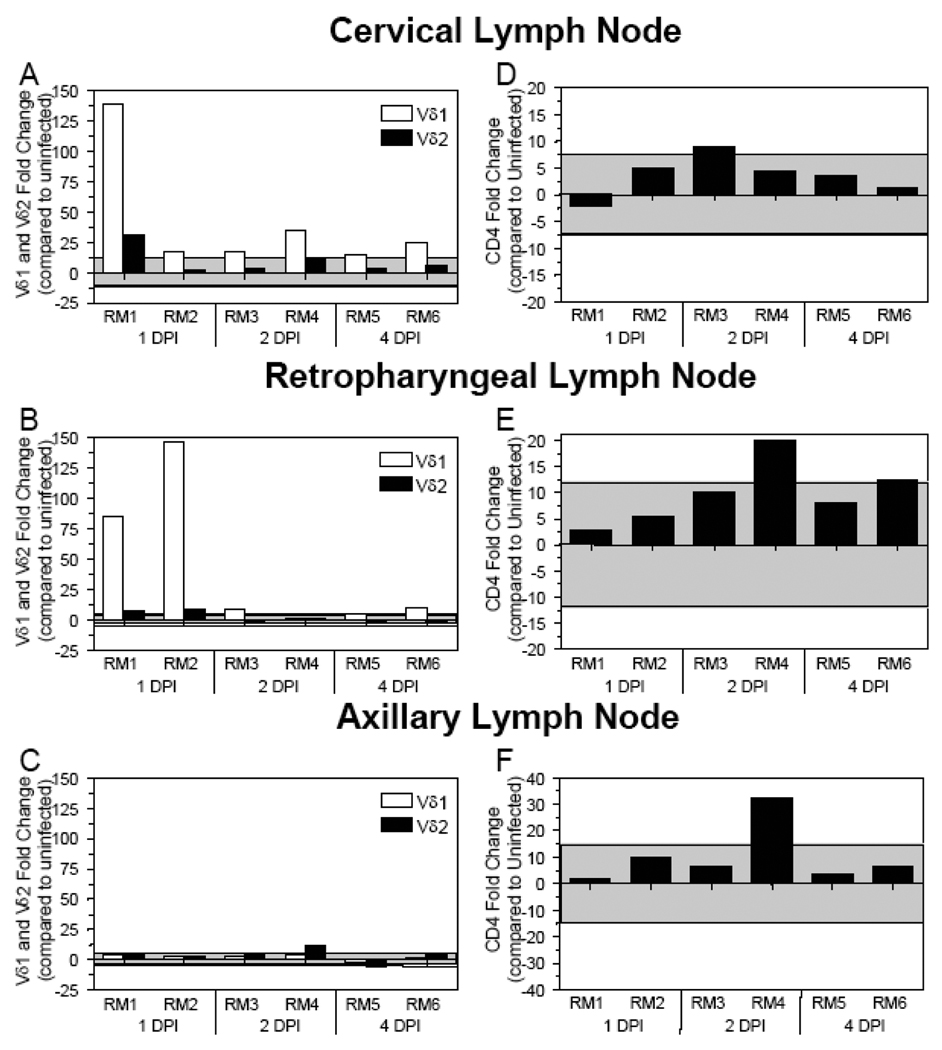
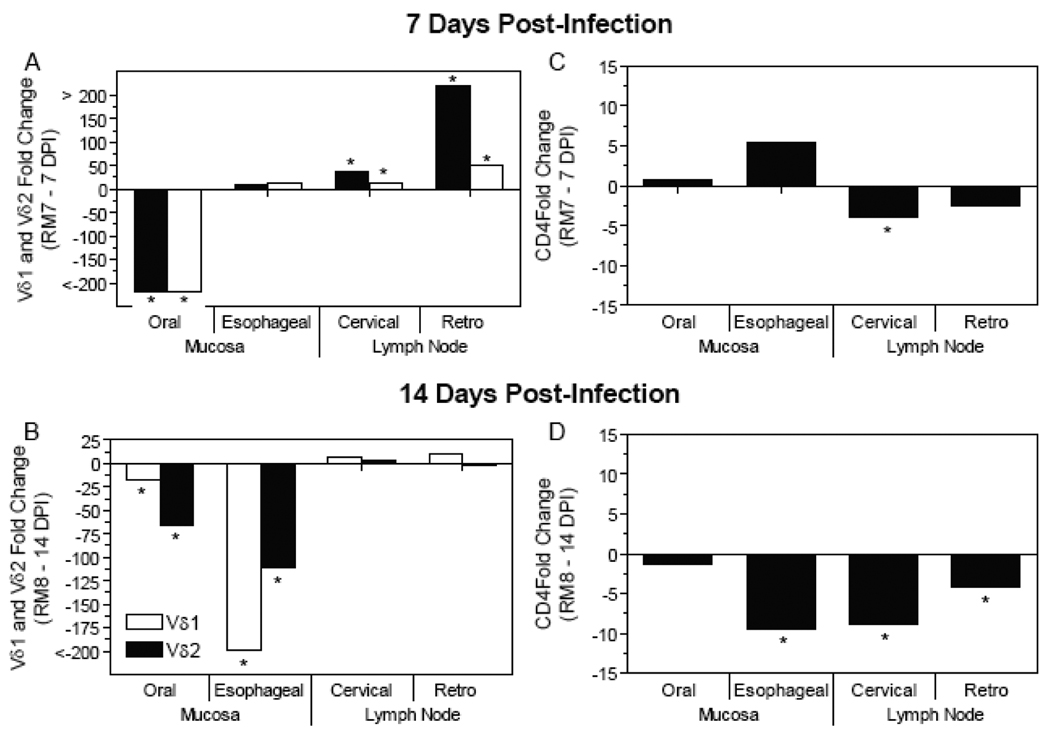
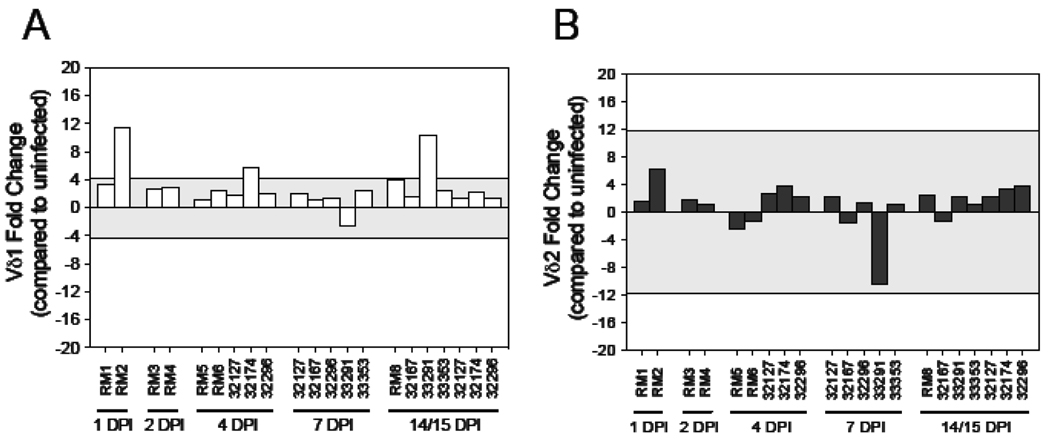
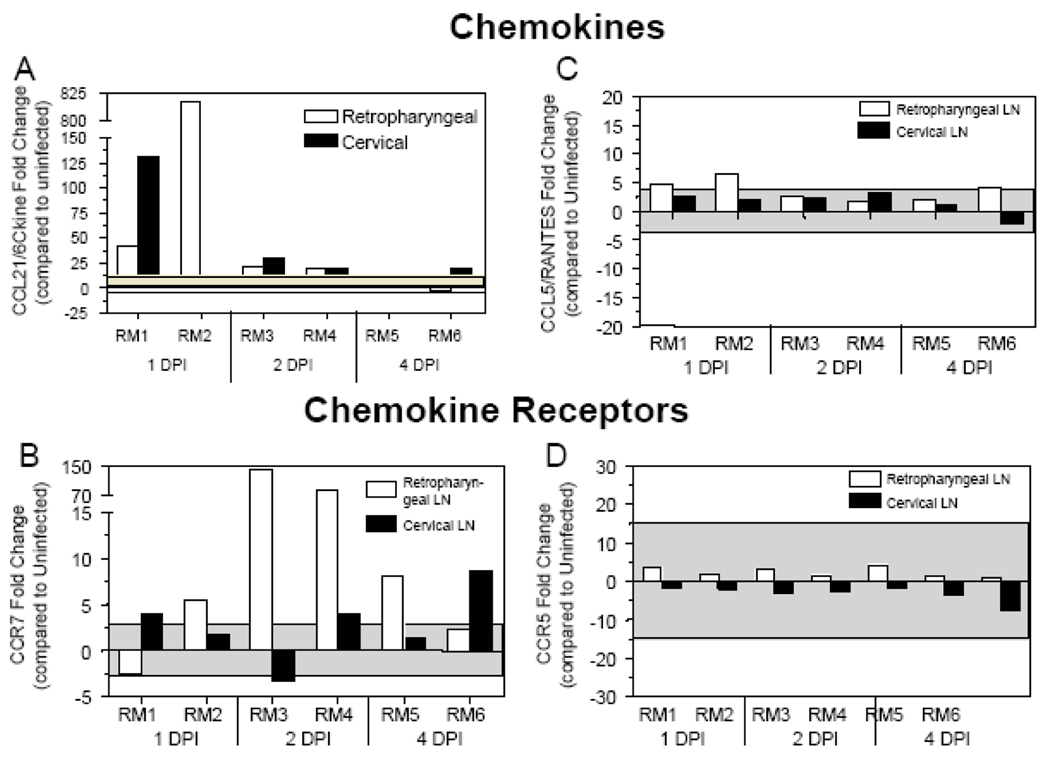
The oral and esophageal mucosa have been identified as possible sites of HIV/SIV entry following oral infection. Here, gamma/delta (gammadelta) T cells, a multi-functional T cell subset, were assessed at oral/esophageal mucosa and lymphoid sites at the earliest times (1-14 days) post-oral SIV inoculation utilizing quantitative RT-PCR. During these earliest times post-infection, decreased gammadelta TCR mRNA levels were observed at the oral gingiva and esophageal mucosa, while increased levels were observed within regional lymph nodes (cervical and retropharyngeal). Higher lymph node gammadelta TCR levels were associated with increased mRNA expression of the lymphoid homing chemokine/receptor (CCL21/CCR7) pair in these lymph nodes. In contrast to gammadelta TCR levels, CD4 mRNA expression remained relatively stable through 4 days post-infection, and depletion of CD4 T cells was only evident after 7 or 14 days post-infection. The decrease of gammadelta T cell mRNA from mucosal sites and the corresponding increase at lymphoid sites suggest a rapid redistribution of these immune cells at these earliest times post-SIV infection.
Conflict of interest statement
These authors do not have any commercial or other considerations that might be interpreted as a conflict of interest with regard to the data presented herein.
Figures
Similar articles
-
Simian immunodeficiency virus infection potently modulates chemokine networks and immune environments in hilar lymph nodes of cynomolgus macaques.J Acquir Immune Defic Syndr. 2013 Aug 1;63(4):428-37. doi: 10.1097/QAI.0b013e31828ac85f. J Acquir Immune Defic Syndr. 2013. PMID: 23429503 Free PMC article.
-
Severe depletion of CD4+ CD25+ regulatory T cells from the intestinal lamina propria but not peripheral blood or lymph nodes during acute simian immunodeficiency virus infection.J Virol. 2007 Dec;81(23):12748-57. doi: 10.1128/JVI.00841-07. Epub 2007 Sep 12. J Virol. 2007. PMID: 17855517 Free PMC article.
-
Heterogeneity of the simian immunodeficiency virus (SIV) specific CD8(+) T-cell response in mucosal tissues during SIV primary infection.Microbes Infect. 2003 Jul;5(9):757-67. doi: 10.1016/s1286-4579(03)00144-8. Microbes Infect. 2003. PMID: 12850201
-
[T gamma-delta lymphocytes and their role in hypersensitivity processes in the digestive and respiratory mucosa].Allergol Immunopathol (Madr). 2002 Sep-Oct;30(5):273-82. Allergol Immunopathol (Madr). 2002. PMID: 12396962 Review. Spanish.
-
The Hitchhiker Guide to CD4+ T-Cell Depletion in Lentiviral Infection. A Critical Review of the Dynamics of the CD4+ T Cells in SIV and HIV Infection.Front Immunol. 2021 Jul 21;12:695674. doi: 10.3389/fimmu.2021.695674. eCollection 2021. Front Immunol. 2021. PMID: 34367156 Free PMC article.
Cited by
-
Innate immunity including epithelial and nonspecific host factors: workshop 1B.Adv Dent Res. 2011 Apr;23(1):122-9. doi: 10.1177/0022034511399917. Adv Dent Res. 2011. PMID: 21441493 Free PMC article.
-
The oral mucosa immune environment and oral transmission of HIV/SIV.Immunol Rev. 2013 Jul;254(1):34-53. doi: 10.1111/imr.12078. Immunol Rev. 2013. PMID: 23772613 Free PMC article. Review.
-
SIV infection in natural hosts: resolution of immune activation during the acute-to-chronic transition phase.Microbes Infect. 2011 Jan;13(1):14-24. doi: 10.1016/j.micinf.2010.09.011. Epub 2010 Oct 15. Microbes Infect. 2011. PMID: 20951225 Free PMC article. Review.
-
γδ T-cell responses during HIV infection and antiretroviral therapy.Clin Transl Immunology. 2019 Jul 17;8(7):e01069. doi: 10.1002/cti2.1069. eCollection 2019. Clin Transl Immunology. 2019. PMID: 31321033 Free PMC article. Review.
-
Physiology and immunology of mucosal barriers in catfish (Ictalurus spp.).Tissue Barriers. 2015 Jul 15;3(4):e1068907. doi: 10.1080/21688370.2015.1068907. eCollection 2015 Oct-Dec. Tissue Barriers. 2015. PMID: 26716071 Free PMC article. Review.
References
-
- Mattapallil JJ, Douek DC, Hill B, Nishimura Y, Martin M, Roederer M. Massive infection and loss of memory CD4+ T cells in multiple tissues during acute SIV infection. Nature. 2005;434:1093–1097. - PubMed
-
- Veazey RS, DeMaria M, Chalifoux LV, et al. Gastrointestinal tract as a major site of CD4+ T cell depletion and viral replication in SIV infection. Science. 1998;280:427–431. - PubMed
-
- Giorgi JV, Liu Z, Hultin LE, Cumberland WG, Hennessey K, Detels R. Elevated levels of CD38+ CD8+ T cells in HIV infection add to the prognostic value of low CD4+ T cell levels: results of 6 years of follow-up. The Los Angeles Center, Multicenter AIDS Cohort Study. J Acquir Immune Defic Syndr. 1993;6:904–912. - PubMed
-
- Sousa AE, Carneiro J, Meier-Schellersheim M, Grossman Z, Victorino RM. CD4 T cell depletion is linked directly to immune activation in the pathogenesis of HIV-1 and HIV-2 but only indirectly to the viral load. J Immunol. 2002;169:3400–3406. - PubMed
Publication types
MeSH terms
Substances
Grants and funding
LinkOut - more resources
Full Text Sources
Research Materials