Review
. 2008;14(28):3048-65.
doi: 10.2174/138161208786404371.

Imaging virus-associated cancer

Affiliations
Review

Imaging virus-associated cancer

De-Xue Fu et al. Curr Pharm Des. 2008.

Abstract

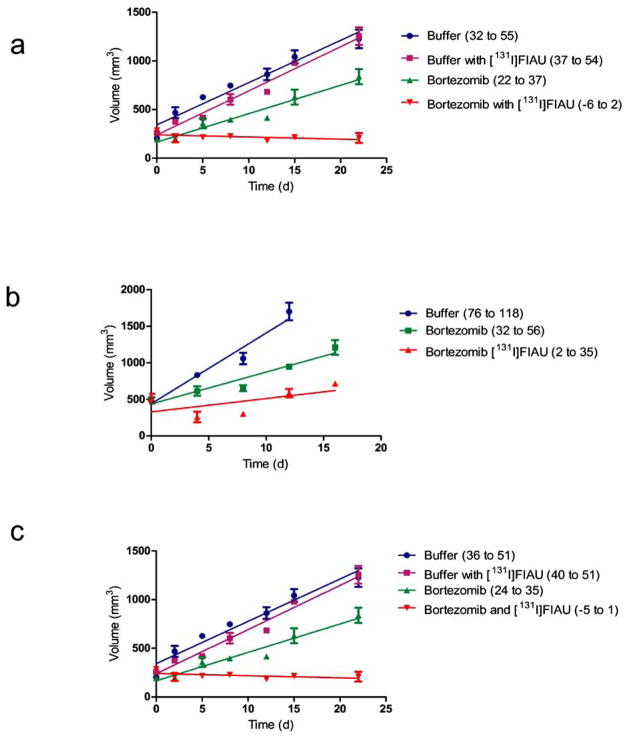
Cancer remains an important and growing health problem. Researchers have made great progress in defining genetic and molecular alterations that contribute to cancer formation and progression. Molecular imaging can identify appropriate patients for targeted cancer therapy and may detect early biochemical changes in tumors during therapy, some of which may have important prognostic implications. Progress in this field continues largely due to a union between molecular genetics and advanced imaging technology. This review details uses of molecular-genetic imaging in the context of tumor-associated viruses. Under certain conditions, and particularly during pharmacologic stimulation, gammaherpesviruses will express genes that enable imaging and therapy in vivo. The techniques discussed are readily translatable to the clinic.


Figures

Fig. 1
Fig. 1. Reporter gene expression imaging with radiolabeled FIAU
Description of herpes simplex virus thymidine kinase (HSV1-TK) type genes as an imaging reporter gene with nucleosides as reporter probes. FIAU and other nucleosides are preferentially phosphorylated by HSV1-TK type reporter genes rather than by mammalian TKs.
Fig. 2
Fig. 2. Nucleosides tested as reporter probes for imaging gene expression
IUDR, (1-(2′-deoxy-5-iodo-1-β-D-ribofuranosyl)-uracil); IVFRU, (1-(2′-deoxy-2′-fluoro-5-iodovinyl-1-β-D-ribofuranosyl)-uracil); FIRU, (1-(2′-deoxy-2′-fluoro-5-iodo-1-β-D-ribofuranosyl)-uracil); FAU, (1-(2′-deoxy-2′-fluoro-β-D-arabinofuranosyl)-uracil); FMAU, (1-(2′-deoxy-2′-fluoro-1-β-D-arabinofuranosyl)-5-methyluracil); FEAU, (1-(2′-deoxy-2′-fluoro-1-β-D-arabinofuranosyl)-5-ethyluracil); FFEAU, (1-(2′-deoxy-2′-fluoro-1-β-D-arabinofuranosyl)-5-fluoroethyluracil); FFAU, (1-(2′-deoxy-2′-fluoro-1-β-D-arabinofuranosyl)-5-fluoroluracil); FCAU, (1-(2′-deoxy-2′-fluoro-1-β-D-arabinofuranosyl)-5-chlorouracil); FBAU, (1-(2′-deoxy-2′-fluoro-1-β-D-arabinofuranosyl)-5-bromouracil); FIAU, (1-(2′-deoxy-2′-fluoro-1-β-D-arabinofuranosyl)-5-iodouracil); GCV, 9-[(2-hydroxy-1-hydroxymethyl)ethoxy)methyl] guanine; PCV, 9-(4-Hydroxy-3-(hydroxymethyl)butyl)guanine; FGCV, 8-fluoro-9-[(2-hydroxy-1-(hydroxymethyl)ethoxy)methyl]guanine; FPCV, 8-fluoro-9-[4-hydroxy-3-(hydroxymethyl)butyl]guanine; FHPG, 9-[(3-fluoro-1-hydroxy-2-propoxy)methyl]guanine; FHBG, 9-(4-fluoro-3-(hydroxymethylbutyl)guanine.
Fig. 3
Fig. 3. [124I]FIAU PET of TK(+) and TK(−) bacterial strains
[124I]FIAU PET of a Balb/c mouse with a TK- S. aureus abscess (left thigh, SA) and TK+ E. coli abscess (right thigh, EC) imaged 3h postinjection of radiopharmaceutical. Two coronal slices are shown, the image in the left panel approximately 3 mm superior to that on the right. PET images were acquired using a GE Vista eXplore small animal PET instrument. T: thyroid; GB: gallbladder; S: stomach; D: duodenum; B: urinary bladder; EC: E. coli; SA: S. aureus.
Fig. 4
Fig. 4. EBV suppression in Rael cells
EBV(+) Rael cells were transfected with a construct carrying the IκB super-repressor [IκB (sr)] and a control vector. After 48 h, viral load was measured by real-time PCR.
Fig. 5
Fig. 5. Imaging EBV-TK(+) tumors in vivo
Two animals at different time points are depicted, one in (A) and (B) and one in (C) and (D). (A) and (B), imaging in tumors (osteosarcoma 143b) engineered to express constitutively the EBV-TK (TK143b). (C) and (D), osteosarcoma 143b tumors that were sham engineered with an empty vector (V143b). Two tumors are present in each animal (large arrows). The dark area [(A), small arrow] represents lead shielding of bladder to improve the dynamic range of the images. Animal in (C) and (D) was pretreated with bortezomib (2 μg/g) to determine whether the agent led to up-regulation of a cellular kinase that might account for FIAU phosphorylation.
Fig. 6
Fig. 6. Bortezomib induces EBV-TK and Zta expression
Immunoblot showing EBV-TK (A) and Zta (B) expression following treatment of an EBV(+) Burkitt’s cell line (Rael) with bortezomib. Total cellular protein was isolated and 10 μg of protein per lane were separated by 12% SDS-PAGE. AGS-HC13 cells expressing Zta promoter were treated with bortezomib, and luciferase activity was measured (C). Accumulation of [14C]FIAU in EBV(+) Burkitt’s [EBV(+) Akata, EBV(+) Rael] but not EBV(−) Burkitt’s [EBV(−) Akata] following treatment with bortezomib (D). BL, Burkitt’s lymphoma.
Fig. 7
Fig. 7. Time course of uptake of [125I]FIAU by Burkitt’s lymphoma xenografts
[EBV(+) Akata] following treatment with bortezomib as assessed by planar gamma scintigraphy in vivo. Large arrows, tumors. The dark area (A, small arrow) represents lead shielding of the bladder to improve the dynamic range of the images. Each animal has one tumor placed in the hind limb. A, no tumor uptake is evident in animals pretreated with PBS only (control). B, tumors are visualized at later time points in the pretreated animals (2 μg/g bortezomib).
Fig. 8
Fig. 8. [125I]FIAU SPECT-CT imaging of tumors following bortezomib treatment
(A) EBV(+) gastric carcinoma (KT) tumor at 72 h postinjection (p.i.). (B) KSHV(+) lymphoma (BCBL1) at 48 h p.i. Arrows indicate tumor location. Side bars indicate the range of [125I]FIAU uptake as percentage injected dose per gram of tissue (ID/g) [0.68% in (A) and 1.53% in (B)].
Fig. 9
Fig. 9. [125I]FIAU tissue distribution in a murine xenograft model
[125I]FIAU (5 μCi) was administered intravenously to SCID mice engrafted with EBV-TK(+) tumors. Animals (3–4 at each time point) were sacrificed and tissue distribution was measured. The percent of the injected dose per gram tissue (%ID/g) is shown in the various organs. Note that after the initial time point, [125I]FIAU remains sequestered solely within the tumor suggesting significant exposure of tumor to β-particle emission with [131I]FIAU.
Fig. 10
Fig. 10. Tumor growth curves in murine xenografts
(a) Mice with control tumors (human osteosarcoma 143B cells with empty vector) or TK expressing tumors (human osteosarcoma 143B cells expressing EBV-TK) were treated intravenously with 1.6 mCi [131I]FIAU or buffered saline. (b) Dose response. Mice with EBV-TK expressing tumors were treated with buffered saline, 1 mCi [131I]FIAU or 3 mCi [131I]FIAU. (c) Mice with tumors resulting from engraftment of admixtures of EBV-TK expressing and control tumor cells were treated with 1.7 mCi [131I]FIAU. Each time point corresponds to 3 animals. The mean, SEM, and least squares linear regression are plotted. The confidence intervals (CI, 95%) of the slopes of the best fit linear regression of tumor growth curves are shown in parentheses in the legend.
Fig. 11
Fig. 11. Tumor growth curves in murine xenografts: comparison to epithelial tumors
(a) EBV(+) Burkitt’s lymphoma (Rael), (b) EBV(+) gastric adenocarcinoma (KT), and (c) KSHV(+) primary effusion lymphoma (BCBL1) were injected intravenously with buffered saline, buffered saline followed 24 hours later by [131I]FIAU, bortezomib alone, or bortezomib followed 24 hours later by [131I]FIAU. Each time point corresponds to 3 animals. Mice were treated with 1.6 mCi (a,c) or 1.7 mCi (b). The mean, SEM, and least squares linear regression are plotted. The confidence intervals (CI, 95%) of the slopes of best fit linear regression of tumor growth curves are shown in parentheses in the legend.

Similar articles

References

    1. Weissleder R, Mahmood U. Molecular imaging. Radiology. 2001;219:316–33. - PubMed
    1. Pomper MG. Molecular imaging: an overview. Acad Radiol. 2001;8:1141–53. - PubMed
    1. Weissleder R, Pittet MJ. Imaging in the era of molecular oncology. Nature. 2008;452:580–9. - PMC - PubMed
    1. Pomper MG. Translational molecular imaging for cancer. Cancer Imaging. 2005;5(SpecA):S16–26. - PMC - PubMed
    1. Kelly KA, Setlur SR, Ross R, et al. Detection of early prostate cancer using a hepsin-targeted imaging agent. Cancer Res. 2008;68:2286–91. - PMC - PubMed

Publication types