

Molecular genetics of addiction and related heritable phenotypes: genome-wide association approaches identify "connectivity constellation" and drug target genes with pleiotropic effects
- PMID: 18991966
- PMCID: PMC3922196
- DOI: 10.1196/annals.1441.018
Molecular genetics of addiction and related heritable phenotypes: genome-wide association approaches identify "connectivity constellation" and drug target genes with pleiotropic effects
Abstract
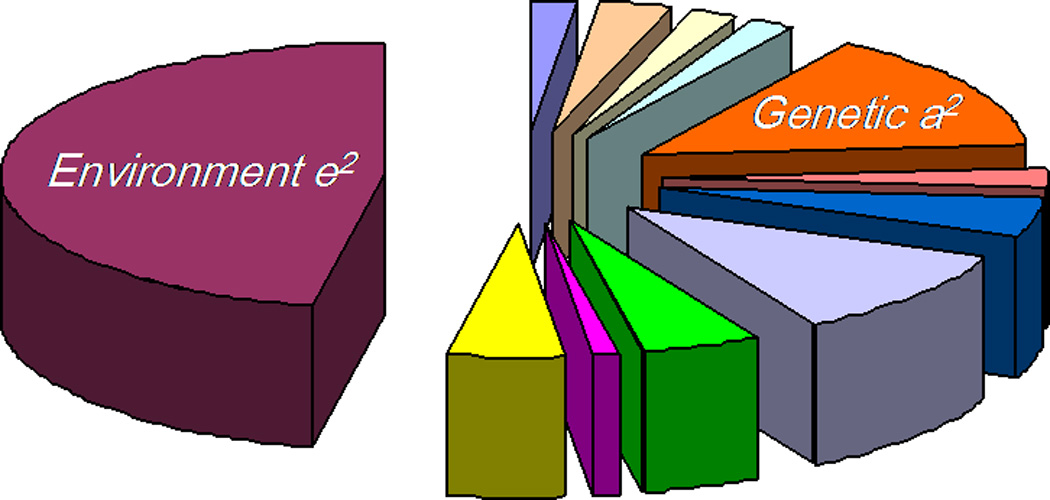
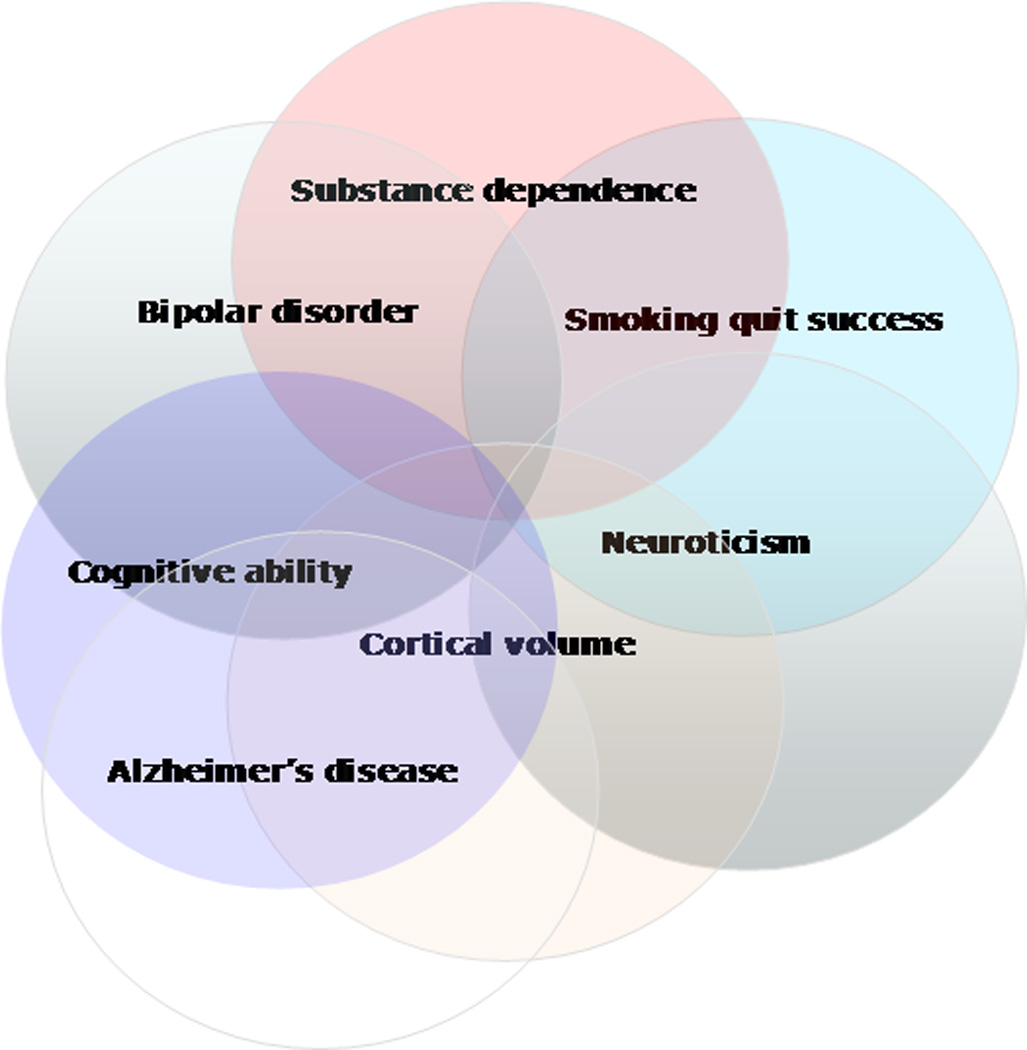
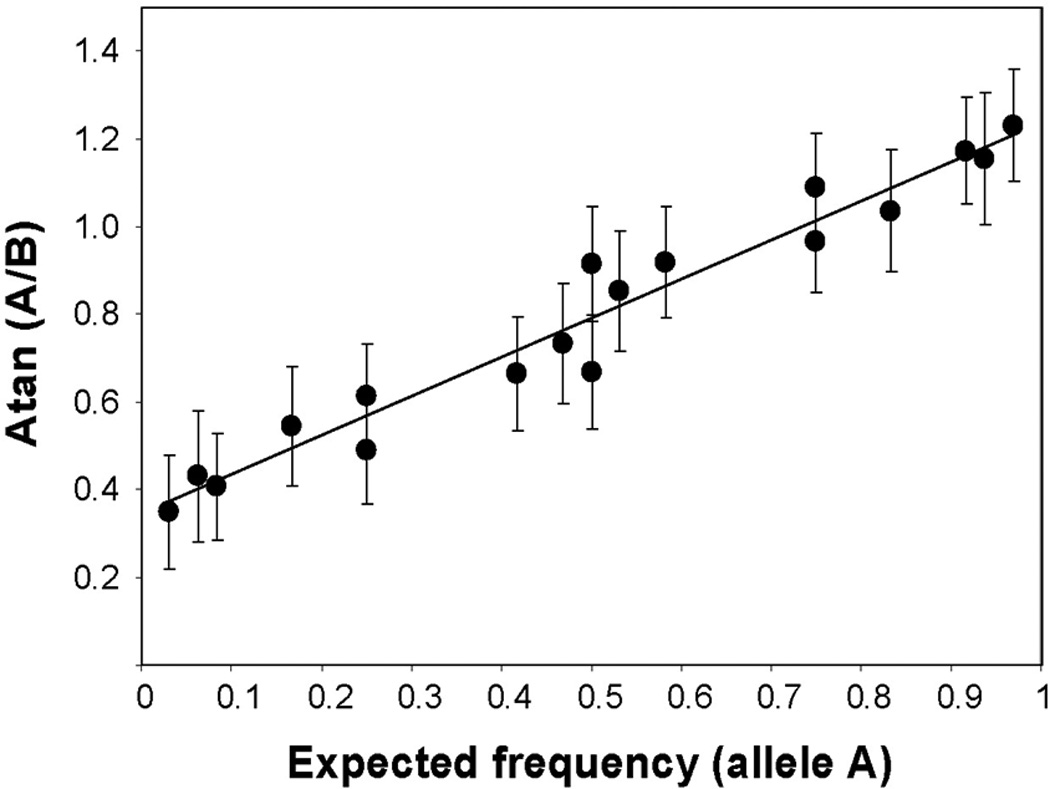
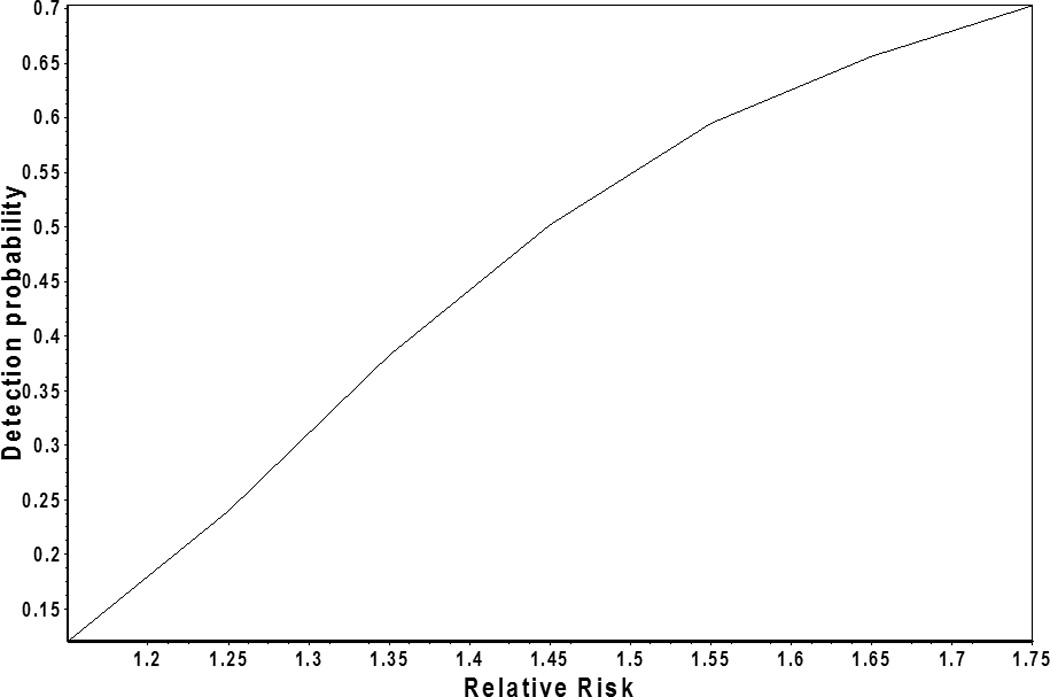
Genome-wide association (GWA) can elucidate molecular genetic bases for human individual differences in complex phenotypes that include vulnerability to addiction. Here, we review (a) evidence that supports polygenic models with (at least) modest heterogeneity for the genetic architectures of addiction and several related phenotypes; (b) technical and ethical aspects of importance for understanding GWA data, including genotyping in individual samples versus DNA pools, analytic approaches, power estimation, and ethical issues in genotyping individuals with illegal behaviors; (c) the samples and the data that shape our current understanding of the molecular genetics of individual differences in vulnerability to substance dependence and related phenotypes; (d) overlaps between GWA data sets for dependence on different substances; and (e) overlaps between GWA data for addictions versus other heritable, brain-based phenotypes that include bipolar disorder, cognitive ability, frontal lobe brain volume, the ability to successfully quit smoking, neuroticism, and Alzheimer's disease. These convergent results identify potential targets for drugs that might modify addictions and play roles in these other phenotypes. They add to evidence that individual differences in the quality and quantity of brain connections make pleiotropic contributions to individual differences in vulnerability to addictions and to related brain disorders and phenotypes. A "connectivity constellation" of brain phenotypes and disorders appears to receive substantial pathogenic contributions from individual differences in a constellation of genes whose variants provide individual differences in the specification of brain connectivities during development and in adulthood. Heritable brain differences that underlie addiction vulnerability thus lie squarely in the midst of the repertoire of heritable brain differences that underlie vulnerability to other common brain disorders and phenotypes.
Figures
Similar articles
-
Convergent genome wide association results for bipolar disorder and substance dependence.Am J Med Genet B Neuropsychiatr Genet. 2009 Mar 5;150B(2):182-90. doi: 10.1002/ajmg.b.30900. Am J Med Genet B Neuropsychiatr Genet. 2009. PMID: 19127564
-
"Replicated" genome wide association for dependence on illegal substances: genomic regions identified by overlapping clusters of nominally positive SNPs.Am J Med Genet B Neuropsychiatr Genet. 2011 Mar;156(2):125-38. doi: 10.1002/ajmg.b.31143. Epub 2010 Dec 16. Am J Med Genet B Neuropsychiatr Genet. 2011. PMID: 21302341 Free PMC article.
-
"Higher order" addiction molecular genetics: convergent data from genome-wide association in humans and mice.Biochem Pharmacol. 2008 Jan 1;75(1):98-111. doi: 10.1016/j.bcp.2007.06.042. Epub 2007 Jul 25. Biochem Pharmacol. 2008. PMID: 17764662 Free PMC article. Review.
-
Genomic regions identified by overlapping clusters of nominally-positive SNPs from genome-wide studies of alcohol and illegal substance dependence.PLoS One. 2011;6(7):e19210. doi: 10.1371/journal.pone.0019210. Epub 2011 Jul 27. PLoS One. 2011. PMID: 21818250 Free PMC article.
-
Addiction genetics and pleiotropic effects of common haplotypes that make polygenic contributions to vulnerability to substance dependence.J Neurogenet. 2009;23(3):272-82. doi: 10.1080/01677060802572929. Epub 2009 Jan 19. J Neurogenet. 2009. PMID: 19152208 Free PMC article. Review.
Cited by
-
Selective breeding for high alcohol consumption and response to nicotine: locomotor activity, dopaminergic in the mesolimbic system, and innate genetic differences in male and female alcohol-preferring, non-preferring, and replicate lines of high-alcohol drinking and low-alcohol drinking rats.Psychopharmacology (Berl). 2018 Sep;235(9):2755-2769. doi: 10.1007/s00213-018-4970-0. Epub 2018 Jul 24. Psychopharmacology (Berl). 2018. PMID: 30043172 Free PMC article.
-
Understanding the Global Problem of Drug Addiction is a Challenge for IDARS Scientists.Curr Neuropharmacol. 2011 Mar;9(1):2-7. doi: 10.2174/157015911795017245. Curr Neuropharmacol. 2011. PMID: 21886551 Free PMC article.
-
Molecular genetics of attention-deficit/hyperactivity disorder: an overview.Eur Child Adolesc Psychiatry. 2010 Mar;19(3):237-57. doi: 10.1007/s00787-010-0090-z. Epub 2010 Feb 10. Eur Child Adolesc Psychiatry. 2010. PMID: 20145962 Free PMC article. Review.
-
Genome-wide association for smoking cessation success: participants in the Patch in Practice trial of nicotine replacement.Pharmacogenomics. 2010 Mar;11(3):357-67. doi: 10.2217/pgs.09.156. Pharmacogenomics. 2010. PMID: 20235792 Free PMC article. Clinical Trial.
-
Confirmation of prior evidence of genetic susceptibility to alcoholism in a genome-wide association study of comorbid alcoholism and bipolar disorder.Psychiatr Genet. 2011 Dec;21(6):294-306. doi: 10.1097/YPG.0b013e32834915c2. Psychiatr Genet. 2011. PMID: 21876473 Free PMC article.
References
-
- Coon KD, et al. A high-density whole-genome association study reveals that APOE is the major susceptibility gene for sporadic late-onset Alzheimer's disease. J Clin Psychiatry. 2007;68(4):613–618. - PubMed
-
- Li H, et al. Candidate Single-Nucleotide Polymorphisms From a Genomewide Association Study of Alzheimer Disease. Arch Neurol. 2007 - PubMed
Publication types
MeSH terms
Substances
Grants and funding
- R01 HL051429/HL/NHLBI NIH HHS/United States
- K08 DA000401/DA/NIDA NIH HHS/United States
- R01 CA63562/CA/NCI NIH HHS/United States
- Z01 DA000401/ImNIH/Intramural NIH HHS/United States
- DA08511/DA/NIDA NIH HHS/United States
- K08 DA014276/DA/NIDA NIH HHS/United States
- WT_/Wellcome Trust/United Kingdom
- 1K08 DA14276-05/DA/NIDA NIH HHS/United States
- Z01 DA000492/ImNIH/Intramural NIH HHS/United States
- K05 DA000492/DA/NIDA NIH HHS/United States
- 076113/WT_/Wellcome Trust/United Kingdom
- P50 CA084719/CA/NCI NIH HHS/United States
- HL51429/HL/NHLBI NIH HHS/United States
- HL32318/HL/NHLBI NIH HHS/United States
- P50 CA84719/CA/NCI NIH HHS/United States
- Z01 DA000537/ImNIH/Intramural NIH HHS/United States
- N01 HD13138/HD/NICHD NIH HHS/United States
- Z01 DA000165/ImNIH/Intramural NIH HHS/United States
- R01 CA063562/CA/NCI NIH HHS/United States
- P50 CA/DA84718/CA/NCI NIH HHS/United States
