. 2008 Nov 7:1:110.
doi: 10.1186/1756-0500-1-110.

Analysis of the genetic variation in Mycobacterium tuberculosis strains by multiple genome alignments

Affiliations

Analysis of the genetic variation in Mycobacterium tuberculosis strains by multiple genome alignments

Andrés Cubillos-Ruiz et al. BMC Res Notes. .

Abstract

Background: The recent determination of the complete nucleotide sequence of several Mycobacterium tuberculosis (MTB) genomes allows the use of comparative genomics as a tool for dissecting the nature and consequence of genetic variability within this species. The multiple alignment of the genomes of clinical strains (CDC1551, F11, Haarlem and C), along with the genomes of laboratory strains (H37Rv and H37Ra), provides new insights on the mechanisms of adaptation of this bacterium to the human host.

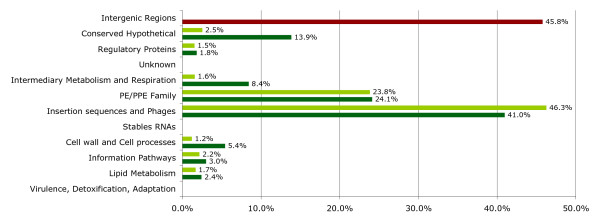
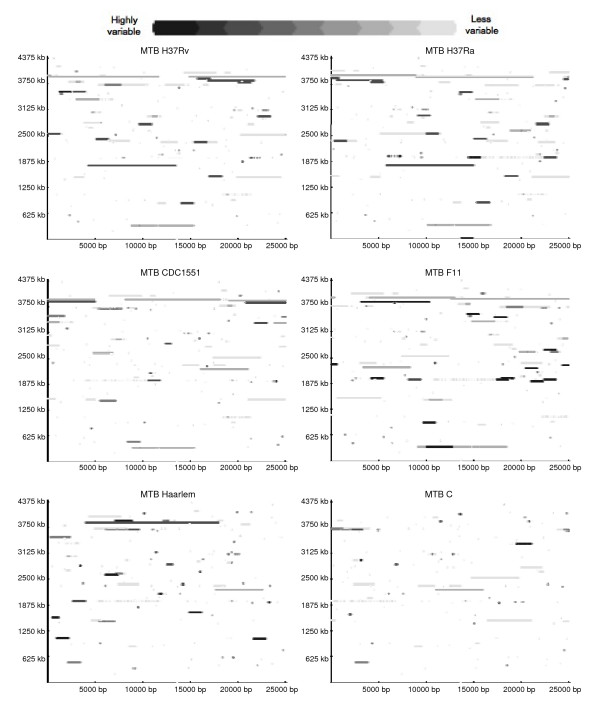
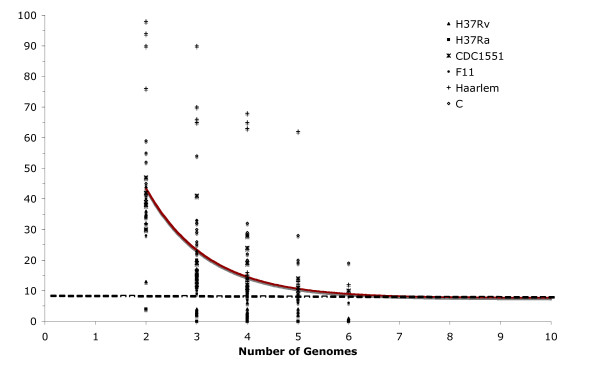
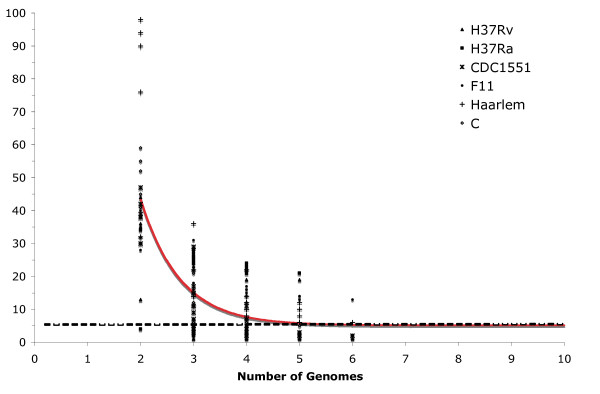
Findings: The genetic variation found in six M. tuberculosis strains does not involve significant genomic rearrangements. Most of the variation results from deletion and transposition events preferentially associated with insertion sequences and genes of the PE/PPE family but not with genes implicated in virulence. Using a Perl-based software islandsanalyser, which creates a representation of the genetic variation in the genome, we identified differences in the patterns of distribution and frequency of the polymorphisms across the genome. The identification of genes displaying strain-specific polymorphisms and the extrapolation of the number of strain-specific polymorphisms to an unlimited number of genomes indicates that the different strains contain a limited number of unique polymorphisms.

Conclusion: The comparison of multiple genomes demonstrates that the M. tuberculosis genome is currently undergoing an active process of gene decay, analogous to the adaptation process of obligate bacterial symbionts. This observation opens new perspectives into the evolution and the understanding of the pathogenesis of this bacterium.


Figures

Figure 1
Figure 1
Functional category classification of the LSPs found in the multiple alignments. Dark green bars represent the variation in each category respect to the total of LSPs. The percentages are given with respect to a total of 166 matches because there are genes that are classified in more than one functional category. Light green bars represent the percentage of LSPs found respect to the total number of genes in each category. The percentage of the intergenic region category (red bar) represents the LSPs that involved a non-coding region.
Figure 2
Figure 2
Distribution and frequency of LSPs in strains H37Rv, H37Ra, CDC1551, F11, Haarlem and C. The picture depicts LSP sites observed for each of the six strains (MTB H37Rv, H37Ra, CDC1551, F11, Haarlem and C) with respect to the other strains. The frequency of the LSP can be inferred from the color scale. Background color represents invariable positions. The base of the square is 25,000 bp and the sizes of the LSPs are proportionately scaled.
Figure 3
Figure 3
Extrapolation of strain-specific deletions. The number of specific deletions is plotted as a function of the number n of strains. For each n, markers are the 6!/[(n - 1)!·(6 - n)!] values obtained for the different strain combinations. The continuous curve represents the least-squares fit of the function Fs(n) = κs exp [-ns] + Ω, where κs = 186.7 ± 44.3, -1/τs = -0.83 ± 0.13 and Ω = 7.6 ± 1.7. The best fit obtained had a correlation of 0.997.
Figure 4
Figure 4
Extrapolation of strain-specific insertions. The number of specific insertions is plotted as a function of the number n of strains. For each n, markers are the 6!/[(n - 1)!·(6 - n)!] values obtained for the different strain combinations. The continuous curve represents the least-squares fit of the function Fs(n) = κs exp [-ns] + Ω where κs = 578.35 ± 198.07, -1/τs = -1.36 ± 0.18 and Ω = 5.1 ± 1.1. The best fit was obtained with a correlation of 0.998.

References

    1. Gutierrez MC, Brisse S, Brosch R, Fabre M, Omais B, Marmiesse M, Supply P, Vincent V. Ancient origin and gene mosaicism of the progenitor of Mycobacterium tuberculosis. PLoS Pathog. 2005;1:e5. doi: 10.1371/journal.ppat.0010005. - DOI - PMC - PubMed
    1. Medini D, Donati C, Tettelin H, Masignani V, Rappuoli R. The microbial pan-genome. Curr Opin Genet Dev. 2005;15:589–594. doi: 10.1016/j.gde.2005.09.006. - DOI - PubMed
    1. Shimono N, Morici L, Casali N, Cantrell S, Sidders B, Ehrt S, Riley LW. Hypervirulent mutant of Mycobacterium tuberculosis resulting from disruption of the mce1 operon. Proc Natl Acad Sci USA. 2003;100:15918–15923. doi: 10.1073/pnas.2433882100. - DOI - PMC - PubMed
    1. Reed MB, Gagneux S, Deriemer K, Small PM, Barry CE., 3rd The W-Beijing lineage of Mycobacterium tuberculosis overproduces triglycerides and has the DosR dormancy regulon constitutively upregulated. J Bacteriol. 2007;189:2583–2589. doi: 10.1128/JB.01670-06. - DOI - PMC - PubMed
    1. Cole ST, Brosch R, Parkhill J, Garnier T, Churcher C, Harris D, Gordon SV, Eiglmeier K, Gas S, Barry CE, 3rd, et al. Deciphering the biology of Mycobacterium tuberculosis from the complete genome sequence. Nature. 1998;393:537–544. doi: 10.1038/31159. - DOI - PubMed

LinkOut - more resources