

Conversation effects on neural mechanisms underlying reaction time to visual events while viewing a driving scene using MEG
- PMID: 18992728
- PMCID: PMC2741688
- DOI: 10.1016/j.brainres.2008.10.001
Conversation effects on neural mechanisms underlying reaction time to visual events while viewing a driving scene using MEG
Abstract
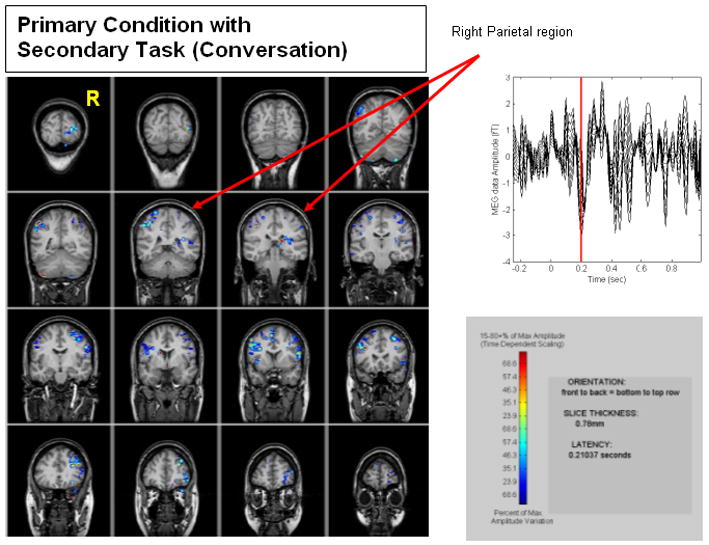
Magnetoencephalography (MEG) imaging examined the neural mechanisms that modulate reaction times to visual events while viewing a driving video, with and without a conversation. Twenty-four subjects ages 18-65 were monitored by whole-head MEG. The primary tasks were to monitor a driving video and to depress a foot pedal in response to a small red light presented to the left or below the driving scene at unpredictable times. The behavioral reaction time (RT) to the lights was recorded. The secondary task was a hands-free conversation. The subject pressed a button to answer a ring tone, and then covertly answered pre-recorded non-emotional questions such as "What is your birth date?" RTs for the conversation task (1043 ms, SE=65 ms) were slightly longer than for the primary task (baseline no conversation (944 ms, SE=48 ms)). During the primary task RTs were inversely related to the amount of brain activity detected by MEG in the right superior parietal lobe (Brodmann's Area 7). Brain activity was seen in the 200 to 300 ms range after the onset of the red light and in the visual cortex (BA 19) about 85 ms after the red light. Conversation reduced the strengths of these regression relationships and increased mean RT. Conversation may contribute to increased reaction times by (1) damping brain activation in specific regions during specific time windows, or (2) reducing facilitation from attention inputs into those areas or (3) increasing temporal variability of the neural response to visual events. These laboratory findings should not be interpreted as indicative of real-world driving, without on-road validation, and comparison to other in-vehicle tasks.
Figures


Similar articles
-
Conversation effects on neural mechanisms underlying reaction time to visual events while viewing a driving scene: fMRI analysis and asynchrony model.Brain Res. 2009 Jan 28;1251:162-75. doi: 10.1016/j.brainres.2008.10.002. Epub 2008 Oct 14. Brain Res. 2009. PMID: 18952070
-
Neural networks of response shifting: influence of task speed and stimulus material.Brain Res. 2006 May 23;1090(1):146-55. doi: 10.1016/j.brainres.2006.03.039. Epub 2006 Apr 27. Brain Res. 2006. PMID: 16643867
-
Strengthening of laterality of verbal and visuospatial functions during childhood and adolescence.Hum Brain Mapp. 2009 Feb;30(2):473-83. doi: 10.1002/hbm.20523. Hum Brain Mapp. 2009. PMID: 18219619 Free PMC article.
-
Viewing lip forms: cortical dynamics.Neuron. 2002 Dec 19;36(6):1211-20. doi: 10.1016/s0896-6273(02)01089-9. Neuron. 2002. PMID: 12495633
-
Neural mechanisms of movement speed and tau as revealed by magnetoencephalography.Exp Brain Res. 2009 Jun;195(4):541-52. doi: 10.1007/s00221-009-1822-5. Epub 2009 May 8. Exp Brain Res. 2009. PMID: 19424687
Cited by
-
Cerebral oscillatory activity during simulated driving using MEG.Front Hum Neurosci. 2014 Dec 16;8:975. doi: 10.3389/fnhum.2014.00975. eCollection 2014. Front Hum Neurosci. 2014. PMID: 25566017 Free PMC article.
-
The Shape of a Vehicle Windshield Affects Reaction Time and Brain Activity During a Target Detection Task.Front Hum Neurosci. 2020 May 26;14:183. doi: 10.3389/fnhum.2020.00183. eCollection 2020. Front Hum Neurosci. 2020. PMID: 32528266 Free PMC article.
-
How can audiovisual pathways enhance the temporal resolution of time-compressed speech in blind subjects?Front Psychol. 2013 Aug 16;4:530. doi: 10.3389/fpsyg.2013.00530. eCollection 2013. Front Psychol. 2013. PMID: 23966968 Free PMC article.
-
A selective review of simulated driving studies: Combining naturalistic and hybrid paradigms, analysis approaches, and future directions.Neuroimage. 2012 Jan 2;59(1):25-35. doi: 10.1016/j.neuroimage.2011.06.037. Epub 2011 Jun 21. Neuroimage. 2012. PMID: 21718791 Free PMC article. Review.
-
Cooperation in Online Conversations: The Response Times as a Window Into the Cognition of Language Processing.Front Psychol. 2019 Apr 9;10:727. doi: 10.3389/fpsyg.2019.00727. eCollection 2019. Front Psychol. 2019. PMID: 31024385 Free PMC article.
References
-
- Underwood G, Chapman P, Brocklehurst N, Underwood J, Crundall D. Visual attention while driving: sequences of eye fixations made by experienced and novice drivers. Ergonomics. 2003;46(6):629–646. - PubMed
-
- Young R. Association between embedded cellular phone calls and vehicle crashes involving airbag deployment in First International Symposium on Human Factors in Driver Assessment, Training, and Vehicle Design; Public Policy Center, University of Iowa; 2001.
-
- Angell LS, Young RA, Hankey JM, Dingus TA. Society of Automotive Engineers. Washington, DC, USA: 2002. An evaluation of alternative methods for assessing driver workload in the early development of in-vehicle information systems.
-
- Strayer DL, Johnston WA. Driven to distraction: Dual-task studies of simulated driving and conversing on a cellular phone. Psychological Science. 2001;12:462–466. - PubMed
-
- Rensink RA, O’Regan JK, Clark JJ. To see or not to see: The need for attention to perceive changes in scenes. Psychological Science. 1997;8(5):368–373.
Publication types
MeSH terms
Grants and funding
LinkOut - more resources
Full Text Sources
