Review
. 2008 Jul-Nov;102(4-6):195-208.
doi: 10.1016/j.jphysparis.2008.10.019. Epub 2008 Oct 18.

Ionic and neuromodulatory regulation of burst discharge controls frequency tuning

Affiliations
Review

Ionic and neuromodulatory regulation of burst discharge controls frequency tuning

W Hamish Mehaffey et al. J Physiol Paris. 2008 Jul-Nov.

Abstract

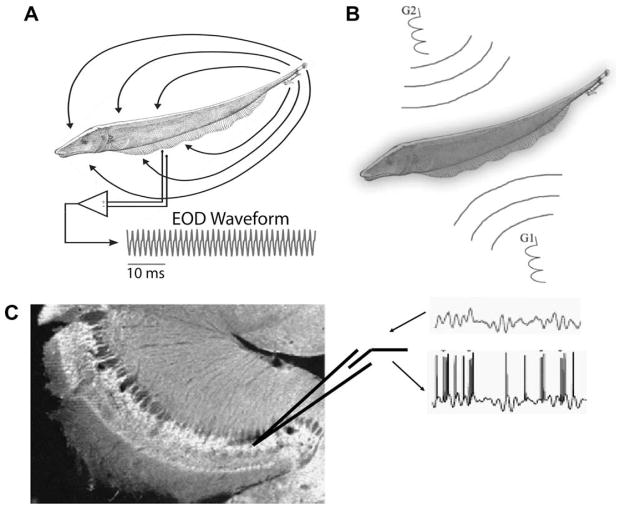
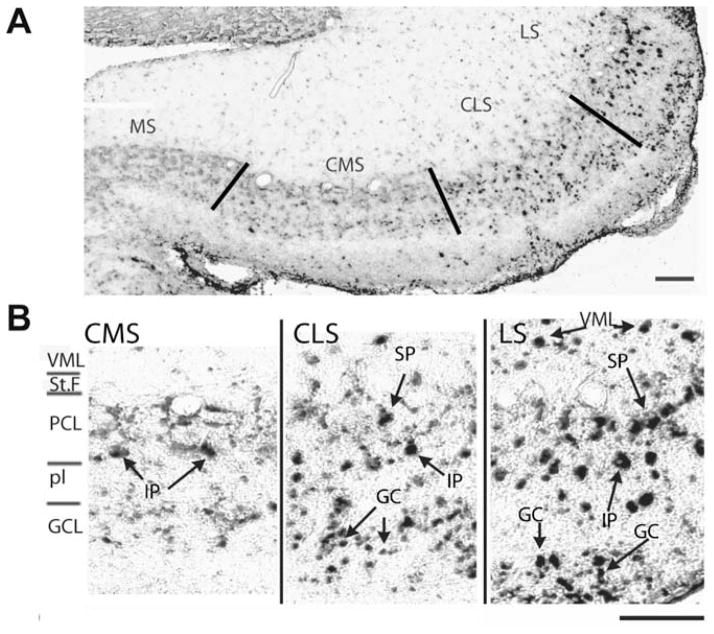
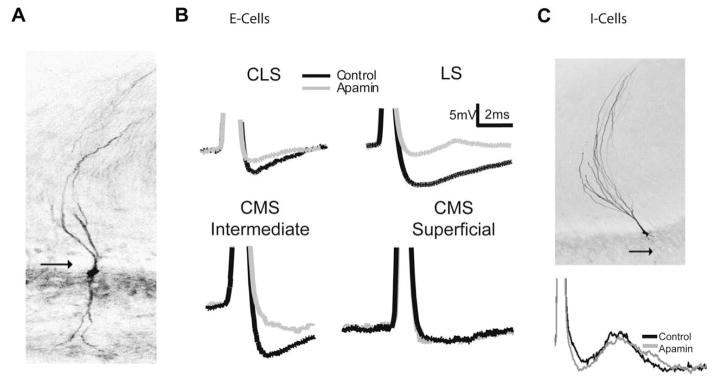
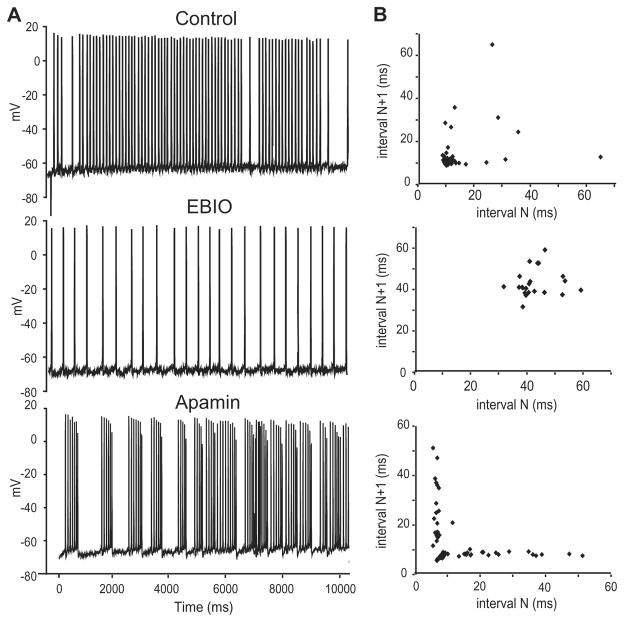
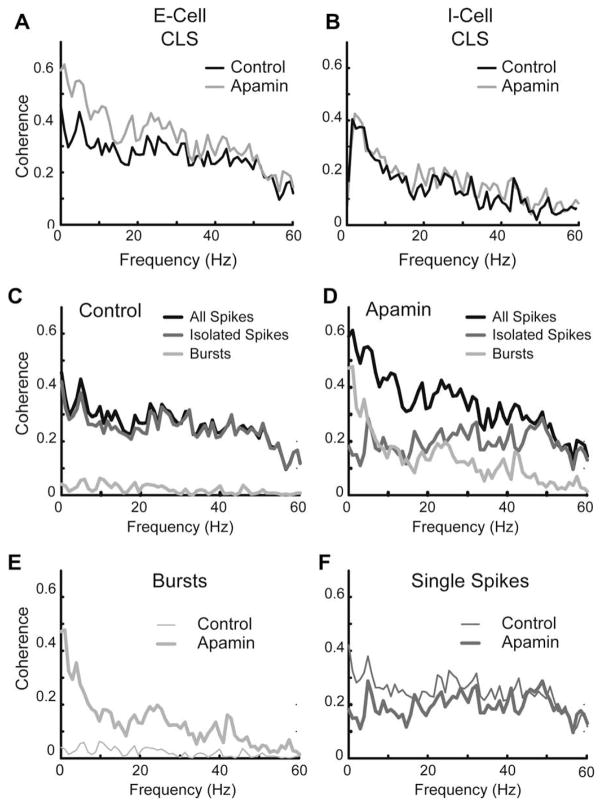
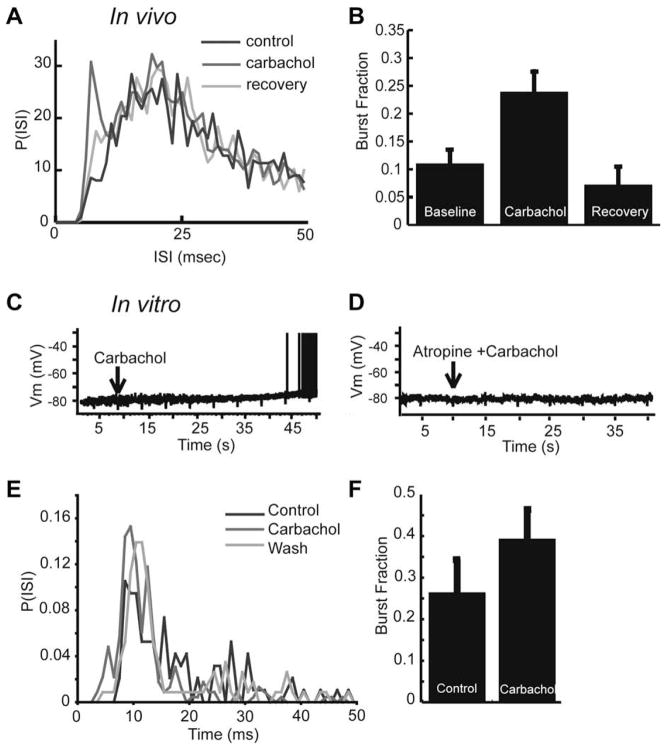
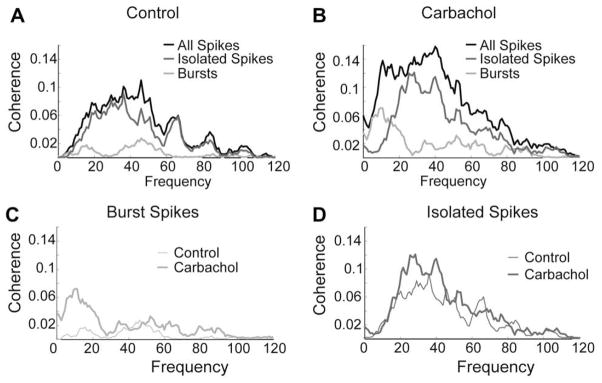
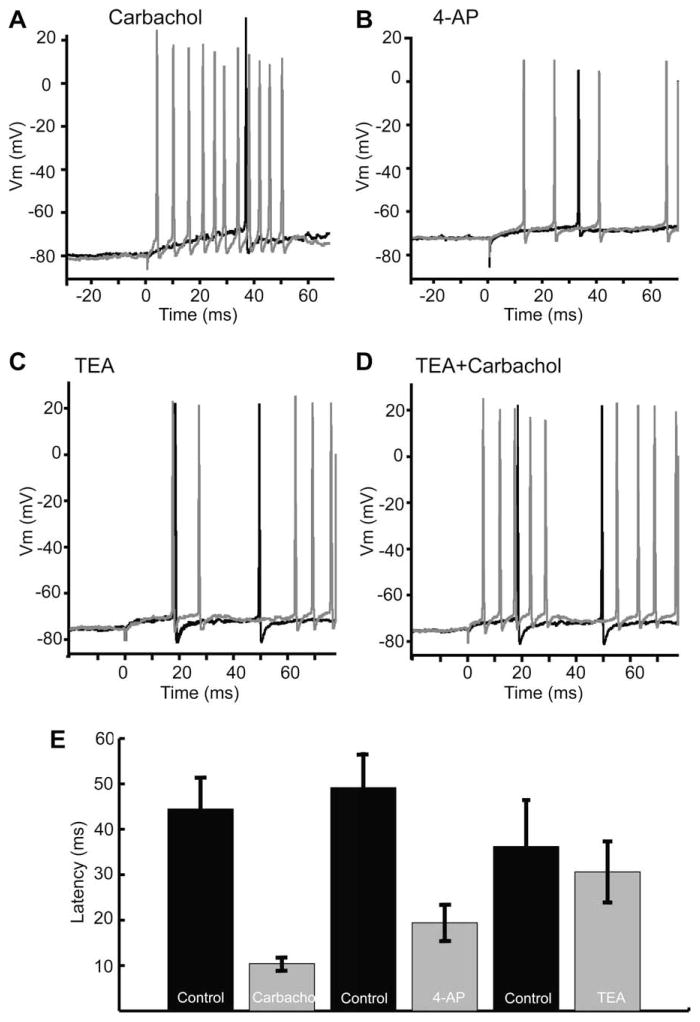
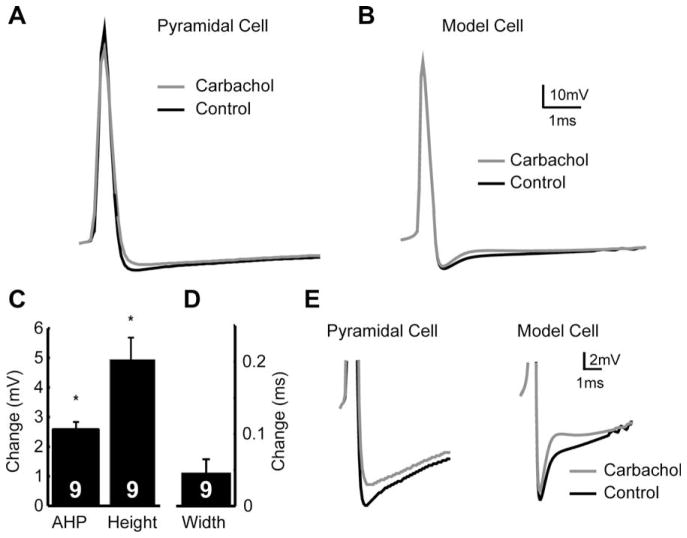
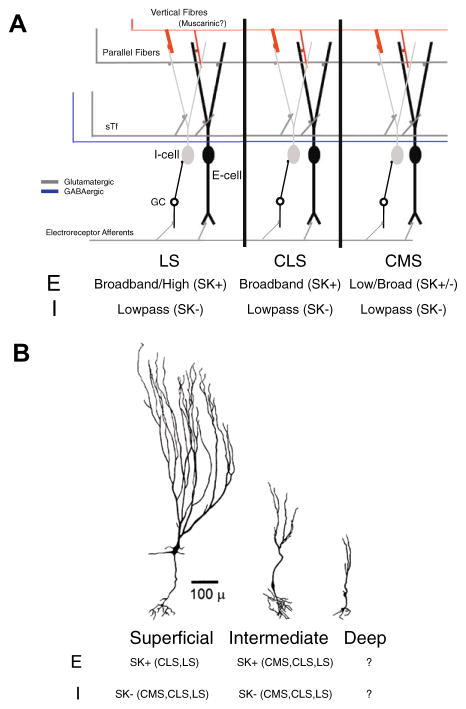
Sensory neurons encode natural stimuli by changes in firing rate or by generating specific firing patterns, such as bursts. Many neural computations rely on the fact that neurons can be tuned to specific stimulus frequencies. It is thus important to understand the mechanisms underlying frequency tuning. In the electrosensory system of the weakly electric fish, Apteronotus leptorhynchus, the primary processing of behaviourally relevant sensory signals occurs in pyramidal neurons of the electrosensory lateral line lobe (ELL). These cells encode low frequency prey stimuli with bursts of spikes and high frequency communication signals with single spikes. We describe here how bursting in pyramidal neurons can be regulated by intrinsic conductances in a cell subtype specific fashion across the sensory maps found within the ELL, thereby regulating their frequency tuning. Further, the neuromodulatory regulation of such conductances within individual cells and the consequences to frequency tuning are highlighted. Such alterations in the tuning of the pyramidal neurons may allow weakly electric fish to preferentially select for certain stimuli under various behaviourally relevant circumstances.


Figures

Fig. 1
Fig. 1
Recording and stimulation protocols. (A) Weakly electric fish generate an electric field around their body in order to electrolocate objects and for communication with conspecifics. For Apteronotus leptorhynchus, the EOD waveform recorded at one point in space is quasi-sinusoidal with a frequency of 600–1000 Hz. (B) Illustration of the Global stimulation geometry used. Amplitude modulations of the animal’s own EOD are delivered via two silver/silver-chloride electrodes (G1 and G2) located 19 cm away on each side of the animal. The perturbations of the EOD created are roughly spatially homogeneous on the animal’s skin surface. (C) Illustration of the in vitro stimulus preparations. AMs similar to those presented in vivo are translated to intracellular stimuli and used to drive pyramidal cells in vitro. Arrows indicate the presentation of an intracellular current stimulus and the recording of the spike train. These can then be analysed in a fashion similar to the in vivo recordings. DC current steps can also be applied.
Fig. 2
Fig. 2
Segmental expression pattern of AptSK2 in the ELL. (A) In situ hybridization analysis of AptSK2 in the ELL. Lines indicate segment divisions of the sensory maps in the ELL. The highest expression is found in the lateral segment (LS), with a lower level found in the centrolateral (CLS) and centromedial segments (CMS). Levels were undetectable in the medial segment (MS). (B) Magnified view of the segmental localization pattern. Superficial (SP) and intermediate (IP) pyramidal neurons are strongly labelled in the LS and CLS along with ventral molecular layer (VML) interneurons and granule cells (GC). In the CMS only intermediate pyramidal neurons display strong SK2 expression. Scale bars: 100 μm. Modified from Ellis et al. (2007b).
Fig. 3
Fig. 3
Apamin sensitivity varies with pyramidal cell subtype, and map. (A) An E cell labelled with neurobiotin showing the presence of a basilar dendrite (arrow). (B) Single cell AHP averages (n = ???) generated via intracellular current injection (0.1 nA) superimposed before and after drug treatment. Neurons in the LS, CLS along with CMS intermediate cells respond to apamin (grey) with a decrease in the size of the AHP. CMS superficial cells do not show a response to apamin. (C) Neurobiotin labelled I cell showing the lack of a basilar dendrite (arrow). Superimposed spike from an I cell showing no change in the AHP following apamin application. Modified from Ellis et al. (2007b).
Fig. 4
Fig. 4
Activity of SK channels regulates bursting. (A) Representative traces from a CLS E cell (0.3nA current injection) showing a regularization of the firing pattern following EBIO (1 mM) and the subsequent conversion to a burst-firing mode following application of apamin (1 μM). (B) Joint interval return maps showing randomly distributed points under baseline conditions confirming a non-bursting firing mode; the shortest ISIs are typically >10 ms. EBIO leads to an increase in ISI values and a regularization that is demonstrated by the presence of a single cluster of long ISIs. Apamin leads to a separation of the return map into a burst cluster (ISIs < 10 ms) and broadly distributed longer ISI returns representing variable inter-burst intervals as previously shown by Turner et al. (1996). Modified from Ellis et al. (2007b).
Fig. 5
Fig. 5
Apamin sensitive currents decrease response to low-frequency stimuli in E, but not I cells. Neurons in vitro were given a random amplitude modulation (RAM) current injection of 0–60 Hz Gaussian noise representative of naturalistic stimuli. (A) Coherence plot of a representative broadband CLS cell showing an increased response to low frequencies following apamin (gray). Neither I cells (B) nor CMS superficial cells (not shown) display frequency-response changes to the RAM following application of apamin (1 uM; grey). (C,D) Separation of the coherence response of the CLS cell from A under control conditions (C) and apamin (D) into components attributable to single spikes (medium gray) or bursts (light grey). (E) Overlay of burst component from C (thin trace) and D (thick trace) showing an increased burst response to low frequencies. (F) Overlay of the isolated spike component from C (thin trace) and D (thick trace) showing only minor response changes. Data from Ellis et al. (2007b).
Fig. 6
Fig. 6
Muscarinic receptor activation leads to an increase in burst firing and low-frequency response in vivo and in vitro. Carbachol increases burst discharge in vivo. (A) ISI histograms before, during, and after, application of carbachol. Carbachol leads to an increase in the number of ISIs shorter than 10 ms. (B) Bar graph representing the average increase of the burst fraction in vivo (fraction of ISIs < 10 ms; control: 0.11 ± 0.10; carbachol: 0.24 ± 0.15) following carbachol and return to control levels following recovery period. (C) In vitro application of carbachol induced a slow depolarization of ELL pyramidal cells, and is sufficient to drive them to fire spikes. (D) Atropine eliminates the carbachol induced depolarization observed in vitro, suggesting mAChR activation. (E) ISI histogram showing an increase in ISI’s < 10 ms following carbachol application in vitro. (F) An increase in the burst fraction is also observed in vitro (fraction of ISIs < 10 ms) after carbachol application. Modified from Ellis et al. (2007a).
Fig. 7
Fig. 7
Muscarinic receptor activation increases the response to low-frequency sensory stimuli in vivo. (A) Under control conditions, the cell has very little low-frequency coherence, and rarely bursts. (B) After application of carbachol the low-frequency coherence increases for the entire spike train, but particularly for the burst spikes. (C) Much of the increase in low-frequency coherence is due to the increase in bursting. (D) A smaller fraction of the < 40 Hz increase is mediated by isolated spikes. Data is shown here for one representative cell.
Fig. 8
Fig. 8
In vitro application of carbachol and 4-AP, but not TEA, leads to a decreased first spike latency, suggesting the involvement of a subthreshold A-type-like current. (A) Carbachol leads to a reduced spike latency following a step current injection (0.2 nA). (B) 4-AP mirrors the effect of carbachol reducing first spike latency in a representative cell. (C) TEA does not alter the spike latency. (D) Carbachol decreases latency even when applied after TEA. (E) Bar graphs showing a significant decrease in latency following carbachol and 4-AP, while TEA failed to cause a significant decrease in latency. Representative cells taken from Ellis et al. (2007a).
Fig. 9
Fig. 9
Carbachol regulates the AHP, which cannot be replicated by removal of an IA current. (A) Representative spikes showing that application of carbachol reduces the AHP amplitude (grey line) relative to control (black line). (B) The removal of IA from a reduced compartmental model can not replicate the decrease in AHP size. (C) Averages showing the changes in AHP size and spike height. (D) As shown by a representative cell, spike width was not significantly affected by carbachol. (E) Insets showing (A) and (B) in greater detail.
Fig. 10
Fig. 10
Pyramidal cell frequency tuning and equipment with SK channels varies with the segment and cell class. (A) Architecture of the ELL, with each of the three tuberous maps shown. Putatively, all three maps receive muscarinic inputs in the DML. The three maps differ in frequency selectivity and SK channels expression in E, but not I type pyramidal cells. (B) Within maps, SK expression can also vary. SK expression is apparent in CMS intermediate, but not superficial E cells. In the CLS and LS SK expression is apparent in both intermediate and superficial E cells. The expression pattern in deep pyramidal cells remains undetermined.

Similar articles

Cited by

References

    1. Abbott LF. Where are the switches on this thing? In: van Hemmen JL, Sejnowski TJ, editors. 23 Problems in Systems Neuroscience. Oxford University Press; 2005. pp. 423–431.
    1. Andermann ML, Ritt J, Neimark MA, Moore CI. Neural correlates of vibrissa resonance; band-pass and somatotopic representation of high-frequency stimuli. Neuron. 2004;42:451–463. - PubMed
    1. Bair W, Koch C, Newsome W, Britten K. Power spectrum analysis of bursting cells in area MT in the behaving monkey. J Neurosci. 1994;14:2870–2892. - PMC - PubMed
    1. Bastian J. Electrolocation II. The effects of moving objects and other electrical stimuli on the activities of two categories of posterior lateral line lobe cells in Apteronotus albifrons. J Comp Physiol [A] 1981;144:481–494.
    1. Bastian J. Plasticity of feedback inputs in the apteronotid electrosensory system. J Exp Biol. 1999;202(Pt 10):1327–1337. - PubMed

Publication types

LinkOut - more resources