Comment
. 2009 Apr 1;45(2):260-6.
doi: 10.1016/j.neuroimage.2008.09.052. Epub 2008 Oct 18.

Abnormal regional brain function in Parkinson's disease: truth or fiction?

Affiliations
Comment

Abnormal regional brain function in Parkinson's disease: truth or fiction?

Yilong Ma et al. Neuroimage. .

Abstract

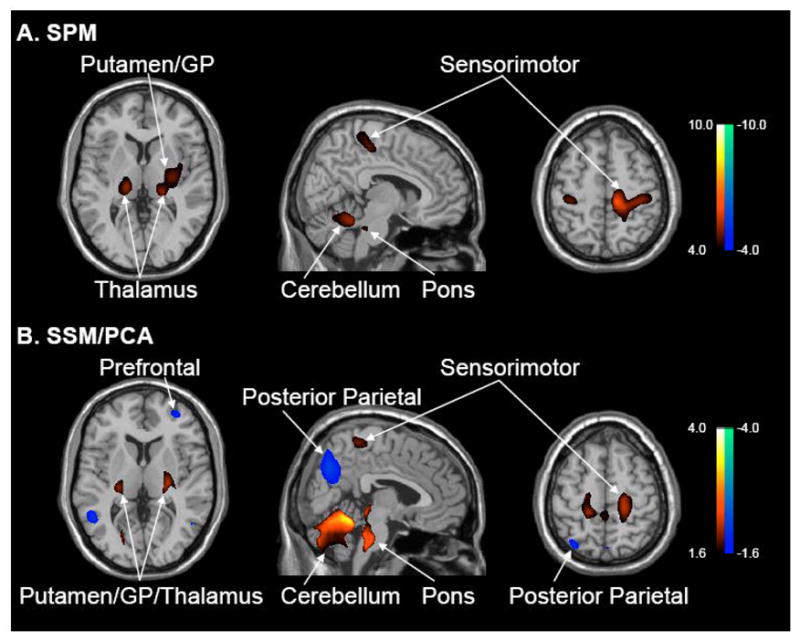
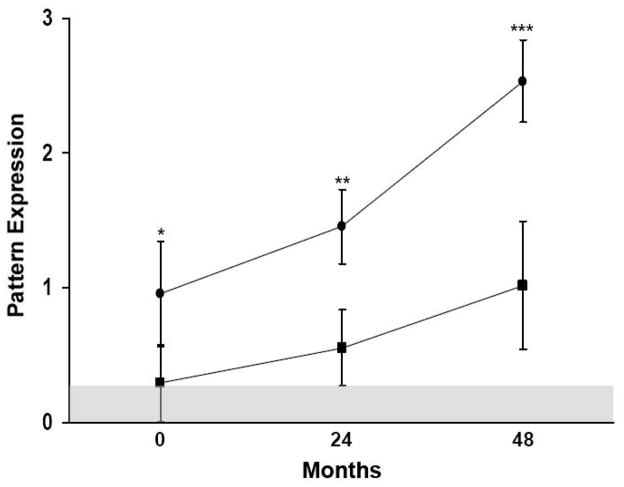
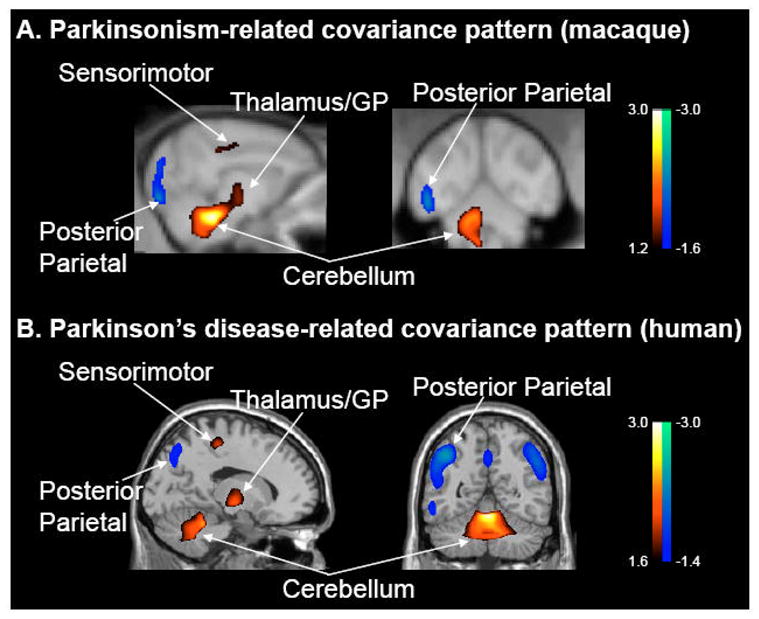
Normalization of regional measurements by the global mean is commonly employed to minimize inter-subject variability in functional imaging studies. This practice is based on the assumption that global values do not substantially differ between patient and control groups. In this issue of NeuroImage, Borghammer and colleagues challenge the validity of this assumption. They focus on Parkinson's disease (PD) and use computer simulations to show that lower global values can produce spurious increases in subcortical brain regions. The authors speculate that the increased signal observed in these areas in PD is artefactual and unrelated to localized changes in brain function. In this commentary, we summarize what is currently known of the relationship between regional and global metabolic activity in PD and experimental parkinsonism. We found that early stage PD patients exhibit global values that are virtually identical to those of age-matched healthy subjects. SPM analysis revealed increased normalized metabolic activity in a discrete set of biologically relevant subcortical brain regions. Because of their higher variability, the corresponding absolute regional measures did not differ across the two groups. Longitudinal imaging studies in this population showed that the subcortical elevations in normalized metabolism appeared earlier and progressed faster than did focal cortical or global metabolic reductions. The observed increases in subcortical activity, but not the global changes, correlated with independent clinical measures of disease progression. Multivariate analysis with SSM/PCA further confirmed that the abnormal spatial covariance structure of early PD is dominated by these subcortical increases as opposed to network-related reductions in cortical metabolic activity or global changes. Thus, increased subcortical activity in PD cannot be regarded as a simple artefact of global normalization. Moreover, stability of the normalized measurements, particularly at the network level, makes these metabolic indices suitable as imaging biomarkers of PD progression and the treatment response.


Figures

Figure 1
Figure 1. Metabolic changes in early Parkinson’s disease
A. Voxel-based comparison of [18F]-fluorodeoxyglucose (FDG) positron emission tomography (PET) scans from 24 early stage Parkinson’s disease (PD) patients and 24 age-matched normal (NL) subjects. Global rates of glucose metabolism (GMR) were similar for the two groups (see text). Significant regional metabolic increases (p<0.05, corrected) were evident in PD that were localized to the putamen/globus pallidus, thalamus, pons, cerebellum, and sensorimotor cortex (see Table 1). No areas of reduced metabolic activity were noted at a hypothesis-testing threshold of p<0.01, uncorrected). [SPM(t) display was overlaid on a standard MRI brain template and thresholded at p<0.001 (uncorrected) with cluster cutoff of 100 voxels]. B. Voxel-based SSM/PCA analysis of the same FDG PET dataset revealed a significant spatial covariance pattern (PC1, 16% VAF) characterized by positive contributions from the areas that were found to be hypermetabolic on the SPM analysis. The pattern also included negative contributions from prefrontal and posterior parietal association areas. Subject scores for this pattern were elevated in PD patients relative to controls (p<0.00001); these values did not correlate with GMR (see text). [Voxel weights on PC1 overlaid on a standard MRI brain template. The display represents voxels that contributed significantly to the pattern (p<0.005), and that were reliable on bootstrap resampling (see text). Voxels with positive region weights are color-coded from red to yellow; those with negative region weights are color-coded from blue to purple].
Figure 2
Figure 2. Longitudinal time course of positive and negative subnetwork expression
Subject scores (mean ± SE) for the positive and negative subnetworks of the PD-related spatial covariance pattern (PDRP) (Ma et al., 2007) were separately computed in scans acquired at each time point as part of a longitudinal PD imaging study (Huang et al., 2007b). The expression of both subnetworks increased over time, but at a faster rate for the positive subnetwork. We found that patient values for the positive subnetwork were abnormally elevated at all three longitudinal time points; those for the negative subnetwork did not differ from control values at any of these time points. [Values for the positive and negative subnetworks at each time point (filled circles and squares, respectively) were displayed relative to mean values measured in 15 age-matched healthy subjects. Subject scores were z-transformed and offset so that the control mean was zero. The shaded area represents 1 SE above the control mean. *p<0.05, **p<0.001, ***p<0.0001, relative to normal values].
Figure 3
Figure 3. Abnormal metabolic covariance patterns in parkinsonian monkeys and PD patients
A. Voxel-based SSM/PCA of high resolution FDG PET images from parkinsonian and healthy age-matched macaques. This analysis revealed a spatial covariance pattern (PC1, 25% VAF) that discriminated the two groups of animals (p<0.0005; see text). The pattern was characterized by positive metabolic contributions from pallidothalamic, pontocerebellar and motor cortical regions, and negative contributions from the posterior parietal cortex. B. This abnormal primate covariance pattern resembles the PDRP topography that has been observed consistently in human subjects with PD (e.g., Ma et al., 2007; cf. Moeller et al., 1999; Eckert et al., 2007). [Both spatial covariance patterns were displayed on standard MRI brain templates. Voxels with positive region weights are color-coded from red to yellow; those with negative region weights are color-coded from blue to purple].

Comment on

References

    1. Alexander GE, Mentis MJ, Van Horn JD, Grady CL, Berman KF, Furey ML, Pietrini P, Rapoport SI, Schapiro MB, Moeller JR. Individual differences in PET activation of object perception and attention systems predict face matching accuracy. Neuroreport. 1999;10:1965–1971. - PubMed
    1. Alexander GE, Moeller JR. Application of the scaled subprofile model to functional imaging in neuropsychiatric disorders: A principal component approach to modeling brain function in disease. Hum Brain Mapp. 1994;2:1–16.
    1. Asanuma K, Tang C, Ma Y, Dhawan V, Mattis P, Edwards C, Kaplitt MG, Feigin A, Eidelberg D. Network modulation in the treatment of Parkinson’s disease. Brain. 2006;129:2667–2678. - PMC - PubMed
    1. Black KJ, Koller JM, Snyder AZ, Perlmutter JS. Template images for nonhuman primate neuroimaging: 2. Macaque NeuroImage. 2001;14:744–748. - PubMed
    1. Bland JM, Altman DG. Calculating correlation coefficients with repeated observations: Part 1--Correlation within subjects. BMJ. 1995;310:446. - PMC - PubMed

Publication types