

Review
doi: 10.1016/j.ejrad.2008.09.019.
Epub 2008 Nov 7.
New horizons in prostate cancer imaging
Affiliations
- PMID: 18993004
- PMCID: PMC2702141
- DOI: 10.1016/j.ejrad.2008.09.019
Item in Clipboard
Review
New horizons in prostate cancer imaging
Eur J Radiol.
2009 May.
Abstract
Prostate cancer is the most common non-cutaneous malignancy among American men. Imaging has recently become more important in detection of prostate cancer since screening techniques such as digital rectal examination (DRE), prostate specific and transrectal ultrasound guided biopsy have considerable limitations in diagnosis and localization of prostate cancer. In this manuscript, we reviewed conventional, functional and targeted imaging modalities used in diagnosis and local staging of prostate cancer with exquisite images.
Figures

Transrectal ultrasound image in the axial plane shows of the peripheral (P) and central (C) zones without evidence of a focal lesion.

Transrectal ultrasound image in axial plane demonstrates a hypoechoic triangular area in the anterior horn of the left peripheral zone that is suspicious for tumor (arrow).

Axial contrast enhanced computed tomography (CT) image of a patient with prostate cancer shows no evidence of tumor within prostate gland (arrow). CT has inherently low contrast resolution for the prostate and surrounding tissues.

Axial contrast enhanced computed tomography images of a patient with prostate cancer (PSA>50ng/ml) shows enlarged prostate gland with an infiltrative tumor lesion (arrows) (a) and distant mediastinal lymph node involvement (arrow) (b) (courtesy of Dr. Musturay Karcaaltincaba, Ankara, Turkey).

Axial contrast enhanced computed tomography images of a patient with prostate cancer (PSA>50ng/ml) shows enlarged prostate gland with an infiltrative tumor lesion (arrows) (a) and distant mediastinal lymph node involvement (arrow) (b) (courtesy of Dr. Musturay Karcaaltincaba, Ankara, Turkey).

Axial T2 weighted images demonstrates a normal peripheral zone (P) which is hyperintense compared to the transitional zone (T), and is separated by a pseudocapsule (arrowheads); additionally the true capsule of the prostate gland is seen as a hypointense rim around the gland (solid arrows) with neurovascular bundles at the posterolateral aspect of the capsule (dashed arrows) (b); normal seminal vesicles (arrows) are seen posterior to base of urinary bladder (UB) (b).

Axial T2 weighted images demonstrates a normal peripheral zone (P) which is hyperintense compared to the transitional zone (T), and is separated by a pseudocapsule (arrowheads); additionally the true capsule of the prostate gland is seen as a hypointense rim around the gland (solid arrows) with neurovascular bundles at the posterolateral aspect of the capsule (dashed arrows) (b); normal seminal vesicles (arrows) are seen posterior to base of urinary bladder (UB) (b).

Axial (a) and sagittal (b) T2 weighted images of a patient with prostate cancer show focal low signal intensity lesion in the left mid peripheral zone (arrows) consistent with prostate cancer.

Axial (a) and sagittal (b) T2 weighted images of a patient with prostate cancer show focal low signal intensity lesion in the left mid peripheral zone (arrows) consistent with prostate cancer.

Axial (a) and coronal (b) T2 weighted images of a patient with prostate cancer shows a tumor in the right mid peripheral zone with extracapsular extension (arrow); additionally a nodular low signal intensity focus invading the pseudocapsule consistent with transitional zone tumor is also seen (arrowheads).

Axial (a) and coronal (b) T2 weighted images of a patient with prostate cancer shows a tumor in the right mid peripheral zone with extracapsular extension (arrow); additionally a nodular low signal intensity focus invading the pseudocapsule consistent with transitional zone tumor is also seen (arrowheads).

Axial (a) and coronal (b) T2 weighted images of a patient with prostate cancer depicts a tumor in the right peripheral zone (asterix). Tumor invades the capsule (arrowhead) and directly extends into the periprostatic space (arrow) (a); moreover tumor invades right obturator internus muscle (arrowhead) (b).

Axial (a) and coronal (b) T2 weighted images of a patient with prostate cancer depicts a tumor in the right peripheral zone (asterix). Tumor invades the capsule (arrowhead) and directly extends into the periprostatic space (arrow) (a); moreover tumor invades right obturator internus muscle (arrowhead) (b).

Axial T2 weighted image of a patient with prostate cancer shows a nodular low signal intensity lesion at the right apex peripheral zone (asterix) with ipsilateral capsular bulge and obliteration of recto-prostatic angle (arrow).

Sagittal T2 weighted image of a patient with prostate cancer demonstrates a big peripheral zone tumor (asterix) which extends superiorly and invades seminal vesicles (arrow).

Axial T1 weighted image (a) of a patient who had TRUS guided sextant biopsy 5 weeks prior to the MRI which shows hyperintense foci consistent with hemorrhage (arrows); numerous low signal intensity foci secondary to hemorrhage mimicking cancers (arrows) are seen on axial T2 weighted image (b).

Axial T1 weighted image (a) of a patient who had TRUS guided sextant biopsy 5 weeks prior to the MRI which shows hyperintense foci consistent with hemorrhage (arrows); numerous low signal intensity foci secondary to hemorrhage mimicking cancers (arrows) are seen on axial T2 weighted image (b).

Axial T2 weighted image of a patient with prostate cancer shows low signal intensity focus suspicious for tumor in the left peripheral zone (arrow) (a); Ktrans and Kep analysis of the corresponding slice performed with a two compartment kinetic model localizes the lesion to the left peripheral zone (arrows) (upper row). Comparison of the gadopentetate dimeglumine concentration versus time curves of the normal (right) and tumor (left) sites demonstrate that wash-in and wash-out processes were more rapid in the tumor (lower row).

Axial T2 weighted image of a patient with prostate cancer shows low signal intensity focus suspicious for tumor in the left peripheral zone (arrow) (a); Ktrans and Kep analysis of the corresponding slice performed with a two compartment kinetic model localizes the lesion to the left peripheral zone (arrows) (upper row). Comparison of the gadopentetate dimeglumine concentration versus time curves of the normal (right) and tumor (left) sites demonstrate that wash-in and wash-out processes were more rapid in the tumor (lower row).

Flow chart shows Krebs cycle and citrate metabolism in normal prostate gland cell. In tumor cells zinc is missing, which leads to re-activation of aconitase that converts citrate to cis-aconitate, ultimately citrate is metabolized in the Krebs cycle instead of being stored, which results in depletion of citrate detected on MR spectroscopy.

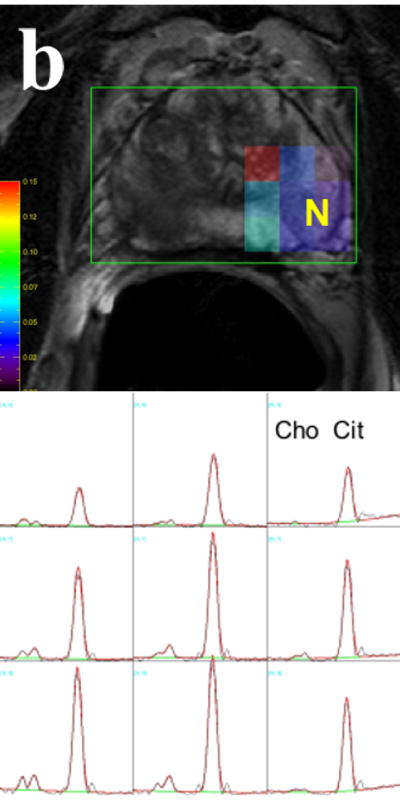
MR spectroscopy image and corresponding voxels demonstrate increased choline and diminished citrate peaks representing tumor (T) (voxels with asterix) at right peripheral zone (a); whereas normal side (N) at left peripheral zone contains normal voxels with normal choline and citrate peaks (b).
MR spectroscopy image and corresponding voxels demonstrate increased choline and diminished citrate peaks representing tumor (T) (voxels with asterix) at right peripheral zone (a); whereas normal side (N) at left peripheral zone contains normal voxels with normal choline and citrate peaks (b).

Axial T2 weighted MR images of a patient with prostate cancer demonstrates bilateral low signal intensity foci suspicious for tumor (arrows) (a), suspicious lesions for cancer appear as bright and dark on corresponding raw diffusion weighted (b) and apparent diffusion coefficient (ADC) maps (c), respectively (arrows).

Axial T2 weighted MR images of a patient with prostate cancer demonstrates bilateral low signal intensity foci suspicious for tumor (arrows) (a), suspicious lesions for cancer appear as bright and dark on corresponding raw diffusion weighted (b) and apparent diffusion coefficient (ADC) maps (c), respectively (arrows).

Axial T2 weighted MR images of a patient with prostate cancer demonstrates bilateral low signal intensity foci suspicious for tumor (arrows) (a), suspicious lesions for cancer appear as bright and dark on corresponding raw diffusion weighted (b) and apparent diffusion coefficient (ADC) maps (c), respectively (arrows).

65 year-old male with stage IV prostate cancer undergoing chemotherapy. Pre-treatment 18F-FDG PET images (a) demonstrate multiple metabolic avid lesions throughout the skeleton. Post-treatment PET images (b) demonstrate interval resolution of the 18F-FDG avid lesions. Pre-treatment and post-treatment bone scans (c and d) demonstrate little interval change (Courtesy of Dr. Steven M. Larson, Memorial Sloan-Kettering Cancer Center).

64 year-old male with non-Hodgkins lymphoma. An incidental focus of increased 18F-FDG uptake in the prostate prompted a biopsy which demonstrated infiltrating adenocarcinoma, gleason 7, stage T3a (courtesy Dr. Annemi Klopper, Cape PET-CT Centre, South Africa).

Transaxial CT (a), PET (b), and fused (c) 18F-FACBC PET/CT images in a patient with rising PSA status post radiation therapy. A focus of increased radiotracer uptake in the periphery of the right prostate gland helped guide biopsy. Transaxial CT (d), 111In capromab SPECT (e), and fused SPECT/CT (f) images demonstrate no abnormal foci of radiotracer uptake. The patient was treated locally with cryotherapy (courtesy of Dr. David Schuster, Emory University).

Coronal PET (a), Transaxial PET (b), Transaxial CT (c), and fused PET/CT (d) 18F-FDHT images in a patient with metastatic prostate cancer demonstrated several foci of increased radiotracer uptake in the skeleton (courtesy of Dr. Heiko Schoder, Memorial Sloan-Kettering Cancer Center).
Similar articles
-
[New ultrasound technologies for the diagnostics of prostate cancer].Radiologe. 2011 Nov;51(11):938, 940-6. doi: 10.1007/s00117-011-2178-y. Radiologe. 2011. PMID: 22083309 German.
-
Imaging localized prostate cancer: current approaches and new developments.AJR Am J Roentgenol. 2009 Jun;192(6):1471-80. doi: 10.2214/AJR.09.2527. AJR Am J Roentgenol. 2009. PMID: 19457807 Free PMC article. Review.
-
New agents and techniques for imaging prostate cancer.J Nucl Med. 2009 Sep;50(9):1387-90. doi: 10.2967/jnumed.109.061838. Epub 2009 Aug 18. J Nucl Med. 2009. PMID: 19690043 Free PMC article. Review.
-
Critical evaluation of magnetic resonance imaging targeted, transrectal ultrasound guided transperineal fusion biopsy for detection of prostate cancer.J Urol. 2013 Oct;190(4):1380-6. doi: 10.1016/j.juro.2013.04.043. Epub 2013 Apr 19. J Urol. 2013. PMID: 23608676 Clinical Trial.
-
Prospects in radionuclide imaging of prostate cancer.Prostate. 2012 Aug 1;72(11):1262-72. doi: 10.1002/pros.22462. Epub 2011 Nov 29. Prostate. 2012. PMID: 22127918 Review.
Cited by
-
Image Guided Planning for Prostate Carcinomas With Incorporation of Anti-3-[18F]FACBC (Fluciclovine) Positron Emission Tomography: Workflow and Initial Findings From a Randomized Trial.Int J Radiat Oncol Biol Phys. 2016 Sep 1;96(1):206-13. doi: 10.1016/j.ijrobp.2016.04.023. Epub 2016 Apr 30. Int J Radiat Oncol Biol Phys. 2016. PMID: 27511856 Free PMC article. Clinical Trial.
-
Positron Emission Tomography Radiotracers for Identification of Site of Recurrence in Prostate Cancer After Primary Treatment Failure.Cancers (Basel). 2025 May 21;17(10):1723. doi: 10.3390/cancers17101723. Cancers (Basel). 2025. PMID: 40427220 Free PMC article. Review.
-
Pretargeted immuno-PET and radioimmunotherapy of prostate cancer with an anti-TROP-2 x anti-HSG bispecific antibody.Eur J Nucl Med Mol Imaging. 2013 Sep;40(9):1377-83. doi: 10.1007/s00259-013-2434-7. Epub 2013 May 15. Eur J Nucl Med Mol Imaging. 2013. PMID: 23674207
-
Diagnostic role of fluorodeoxyglucose positron emission tomography-computed tomography in prostate cancer.Oncol Lett. 2014 Jun;7(6):2013-2018. doi: 10.3892/ol.2014.1997. Epub 2014 Mar 24. Oncol Lett. 2014. PMID: 24932281 Free PMC article.
-
Targeting prostate cancer cells in vivo using a rapidly internalizing novel human single-chain antibody fragment.J Nucl Med. 2010 Mar;51(3):427-32. doi: 10.2967/jnumed.109.069492. Epub 2010 Feb 11. J Nucl Med. 2010. PMID: 20150269 Free PMC article.
References
-
- Jemal A, Siegel R, Ward E, et al. Cancer Statistics, 2007. CA Cancer J Clin. 2007;57:43–66. - PubMed
-
- Wang MC, Valenzuela LA, Murphy GP, Chu TM. Purification of a human prostate specific antigen. Invest Urol. 1979;17:159–163. - PubMed
-
- Gretzer MB, Partin AW. PSA markers in prostate cancer detection. Urologic Clinics of North America. 2003;30:677–+. - PubMed
-
- Hricak H, Choyke PL, Eberhardt SC, Leibel SA, Scardino PT. Imaging prostate cancer: A multidisciplinary perspective. Radiology. 2007;243:28–53. - PubMed
Publication types
MeSH terms
Grants and funding
LinkOut - more resources
Full Text Sources
Medical
