. 2008 Nov 14;29(5):807-18.
doi: 10.1016/j.immuni.2008.09.013.

Receptor-independent, direct membrane binding leads to cell-surface lipid sorting and Syk kinase activation in dendritic cells

Affiliations

Receptor-independent, direct membrane binding leads to cell-surface lipid sorting and Syk kinase activation in dendritic cells

Gilbert Ng et al. Immunity. .

Abstract

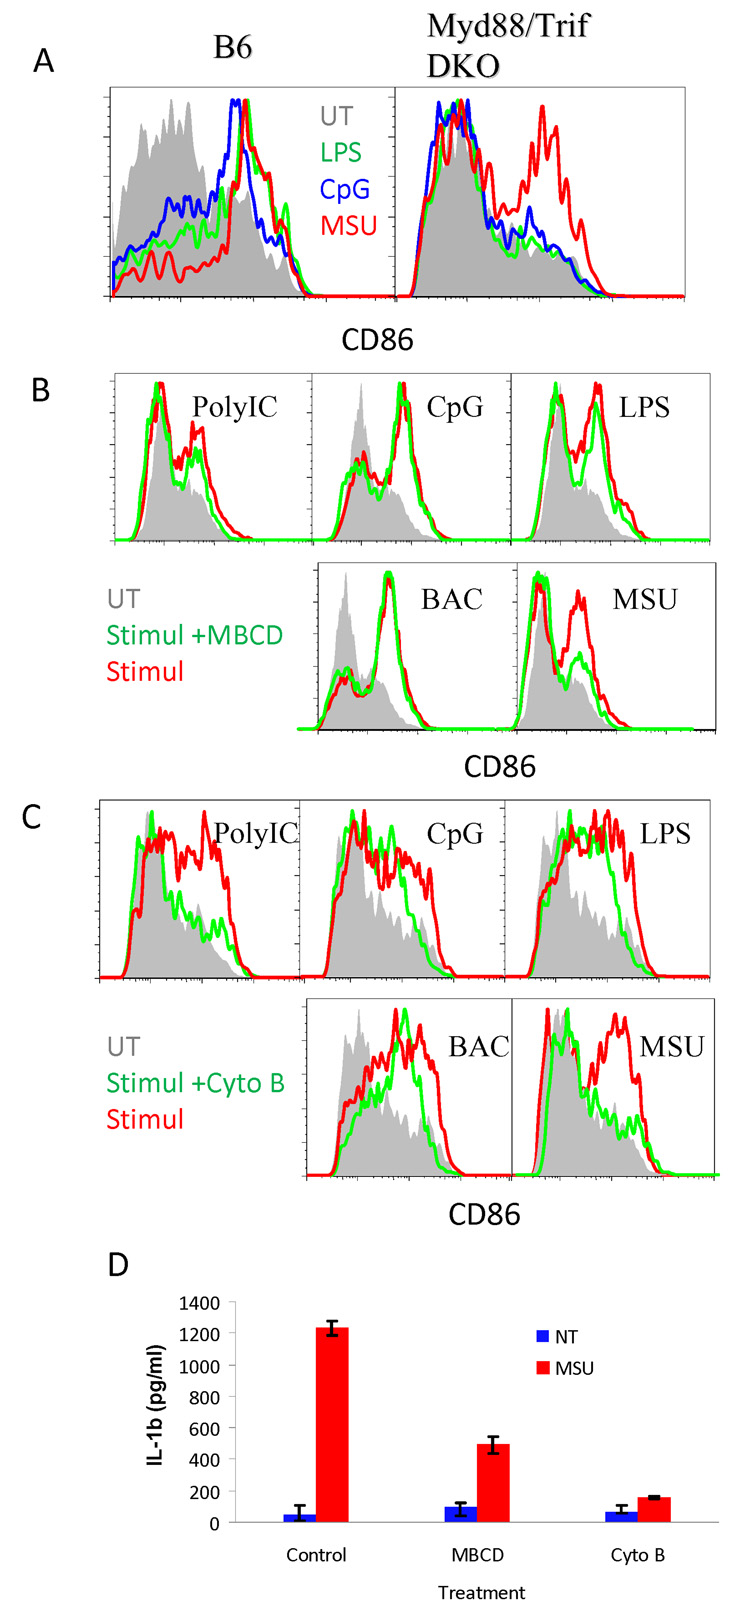
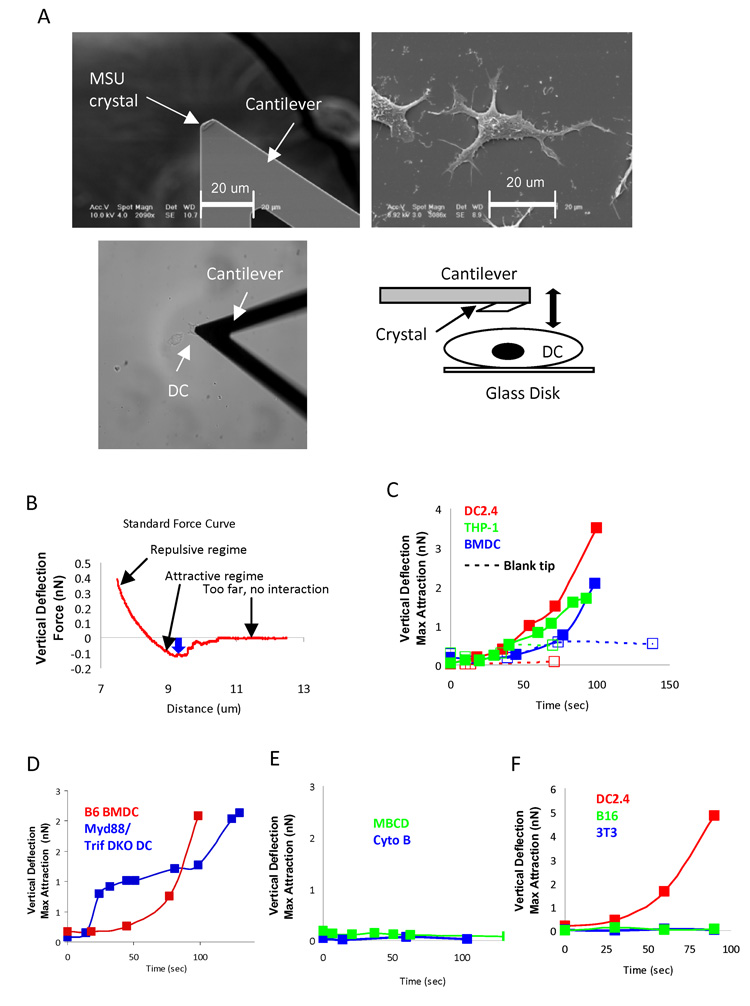
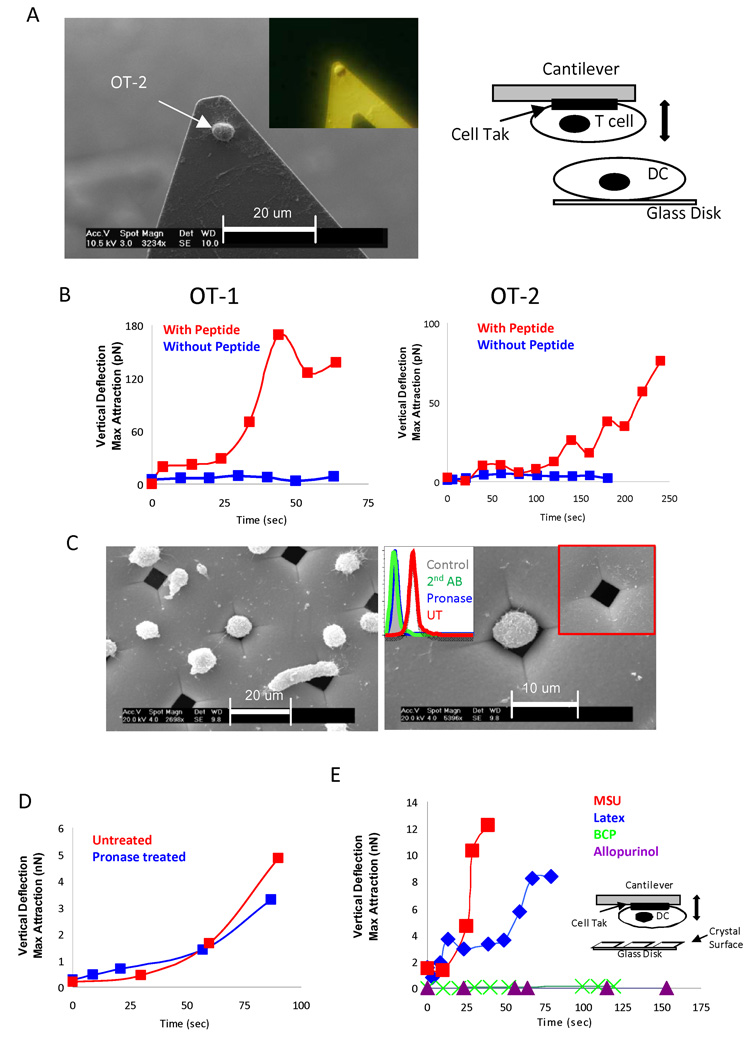
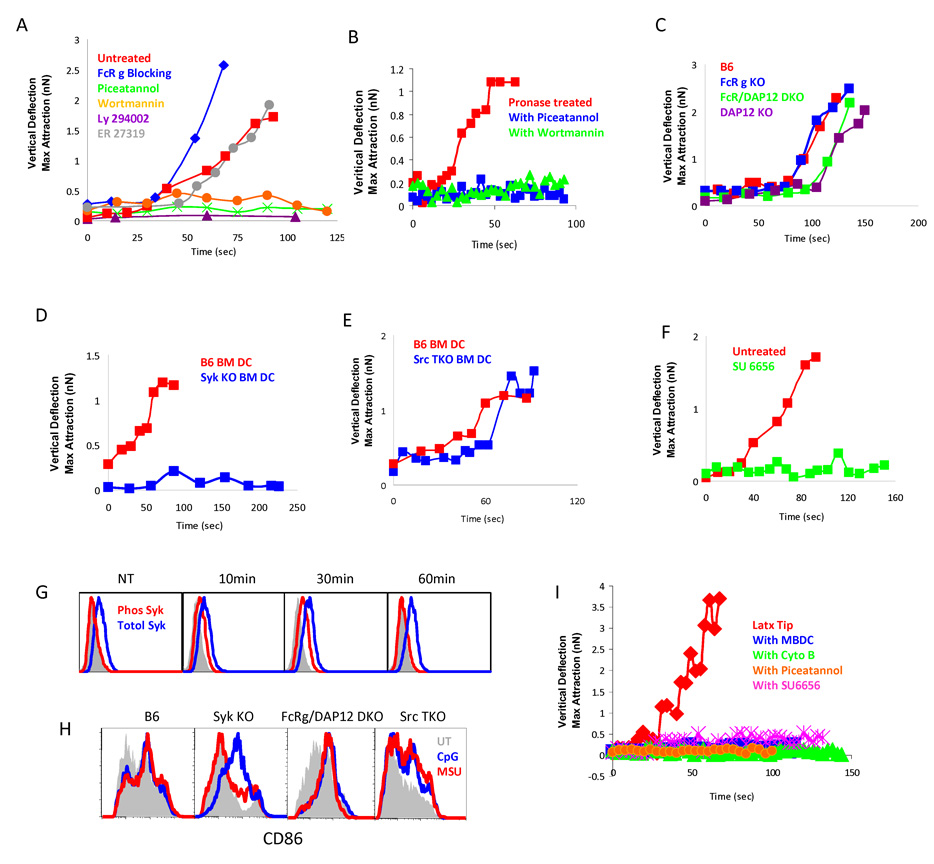
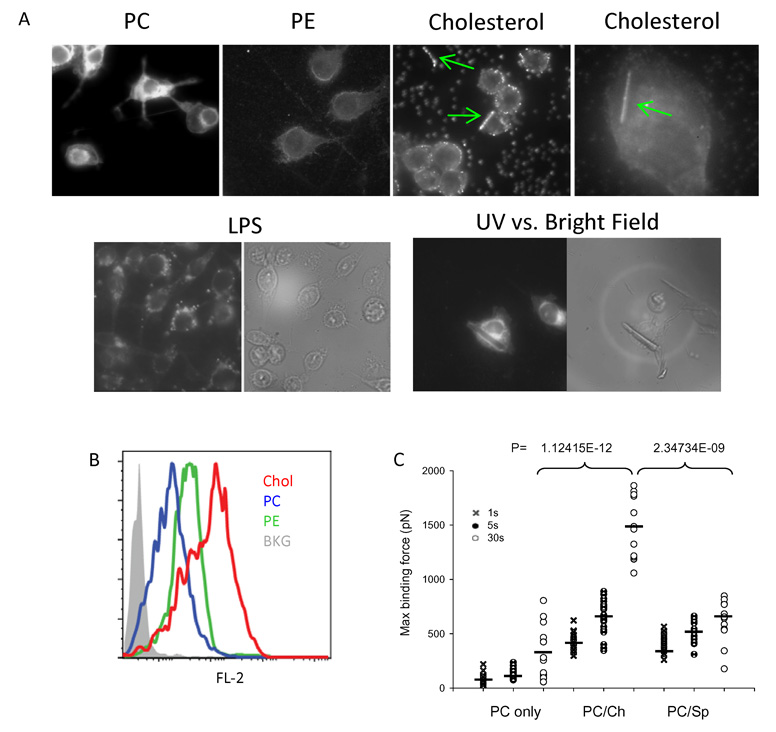
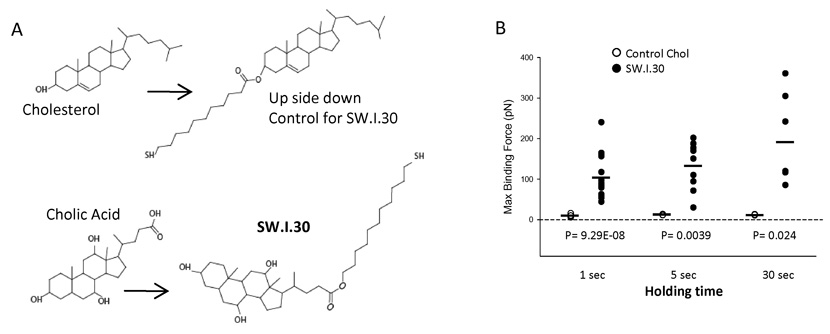
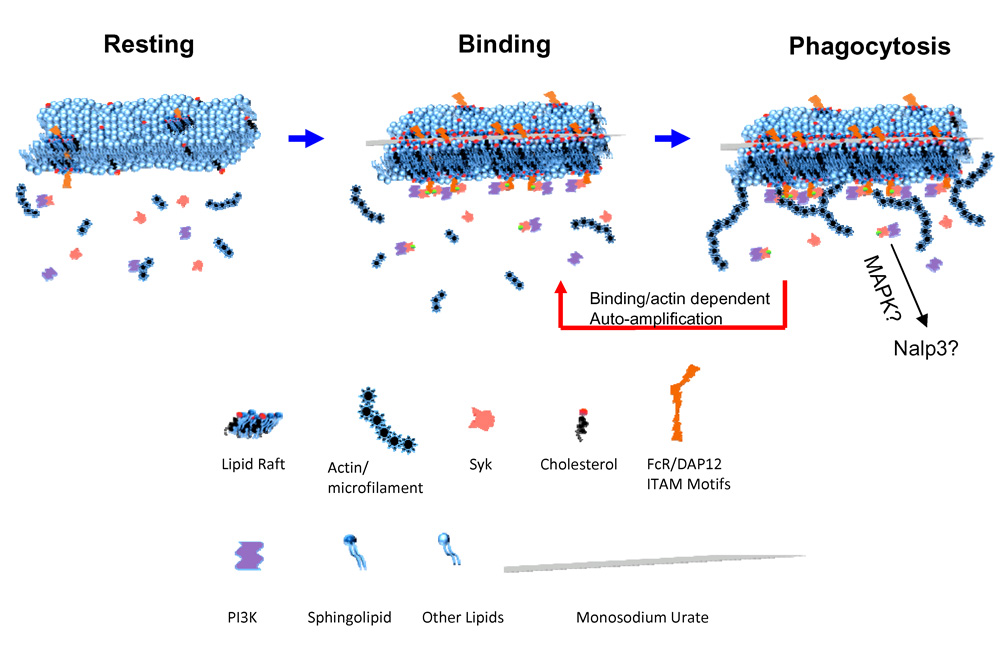
Binding of particulate antigens by antigen-presenting cells is a critical step in immune activation. Previously, we demonstrated that uric acid crystals are potent adjuvants, initiating a robust adaptive immune response. However, the mechanisms of activation are unknown. By using atomic force microscopy as a tool for real-time single-cell activation analysis, we report that uric acid crystals could directly engage cellular membranes, particularly the cholesterol components, with a force substantially stronger than protein-based cellular contacts. Binding of particulate substances activated Syk kinase-dependent signaling in dendritic cells. These observations suggest a mechanism whereby immune cell activation can be triggered by solid structures via membrane lipid alteration without the requirement for specific cell-surface receptors, and a testable hypothesis for crystal-associated arthropathies, inflammation, and adjuvanticity.


Figures

Fig 1
Fig 1. DC MSU crystal recognition depends on membrane cholesterol
A. BM DCs from C57BL/6 WT and Myd88 + TRIF DKO mice were grown as described, and stimulated with 10 ng/ml LPS, 5 ug/ml CpG, or 200 ug/ml MSU crystals for 5 hrs. CD86 expression on CD11c+ cells was analyzed by flow cytometry. B. B6 BMDCs were extracted twice with 10 mM of MBCD in culture media (20 min each). Cells were treated as in A plus 100 ug/ml poly IC or 0.1 ul of killed E. coli (BAC) in 2 ml for 6 hrs in the presence of 2 mM MBCD to prevent membrane cholesterol restoration. Cells were analyzed as in A. C. Identical B except for cytochalasin B (1 ug/ml in the wells throughout the assay) was used in place of MBCD. D. THP-1 cells were stimulated as BM DCs for 6 hours and IL-1β production was measured by ELISA. The error bars represent 2 s.d..
Fig 2
Fig 2. Binding of MSU crystal to DC membrane is of high affinity
A. Upper left: a SEM picture of a MSU crystal glued to the tip of an AFM cantilever; Upper right, a SEM picture of a DC2.4 cell that was cultured at low density; Lower left, a light camera picture of a MSU coated cantilever making contact with a DC, Lower right: a schematic abstract of cantilever with a MSU making contact with a DC. B. A sample force interaction generated by the technique illustrated in A. The distance measurement is at the center of the cell. The blue arrow indicates the maximum adhesion between crystal and the cell in pN or nN. The displacement indicated by the arrow was collected as one data point to plot the binding force change over time in the subsequent figures. Usually, 15 to 30 data points were collected for each binding force curve from which one maximal binding point was determined. C. Binding curves for DC2.4, THP-1, and B6 BM DCs with the MSU tip and a blank control tip (10, 8, and 3). D. B6 BMDC binding force vs. Myd88+TRIF DKO DC (27). E. DC 2.4 binding curves in the presence of MBCD (4) or cytochalasin B (20), THP-1 and BM DCs produced identical data (not shown). F. Binding force of DC2.4 vs. two control non-hematopoietic cell lines, B16 (2) and NIH 3T3 (2).
Fig 3
Fig 3. Binding of MSU to DCs does not require cell surface protein
A. Left: a SEM picture of an OT-2 cell glued to an AFM tip with Cell-Tak; insert: an image of a similarly glued OT-2 cell in pure alcohol without SEM processing, taken with a Nikon metallurgical white light epi-illumination microscope. Right: a schematic depiction of cantilever with a T cell making contact with a DC. B. Left, the binding force change of an OT-1 T cell glued to a cantilever to a DC2.4 with or without SIINFEKL peptide (7 and 6); right, the same set up except that an OT-2 T cell and ISQAVHAAHAEINEAGR peptide were used in place (7 and 4). C. Left. Pronase-treated DC2.4 cells were centrifuged to a nickel grid, and treated and analyzed similarly as in A. Right. A higher magnification of one cell trapped in the grid. The inserts are flow cytometric analysis of the biotin and FITC-conjugated streptavidin staining of the DC2.4 cells with or without the pronase treatment, and an uncovered hole in the nickel mesh. D. The force curve of a DC2.4 cell trapped in the mesh after pronase treatment and its control (27). E. Force curves between a DC2.4 cell glued to a cantilever with the indicated crystal surfaces allopurinol (3), MSU (11) and BCP (3) or 1 um diameter latex beads attached (by heating/drying) to glass disks (7).
Fig 4
Fig 4. Syk kinase and basal ITAM phosphorylation are required for MSU binding and activation
A. As in Fig 2, force curves between DC2.4 and a MSU cantilever were analyzed in the presence of indicated Syk (Piceatannol 6 and ER27319 3), PI3K (Wortmannin 3 and Ly294002 6) or extracellular FcR γ blocker 2.4G1 (10). Similar data with other DCs are not shown. B. Similar to Fig. 3D for the pronase treatment. Cells were treated with either Syk (6) or PI3K inhibitor (6). C. Force curves between the MSU cantilever and the indicated BM DCs with ITAM-deficiencies: DAP12 KO (14), FcR γ KO (27) or DAP12 + FcR γ DKO (17). D. Force curves between MSU cantilever and BM DCs from Syk KO (21). E. Force curves between MSU cantilever and Hck + Fgr + Lyn triple Src KO BM DC (9). F. DC2.4 cell in the presence of the total Src activity blocker SU6656 (15). G. Phos Syk and total Syk were measured in permeabilized DC2.4 cells following MSU treatment as in Fig 1. H. Flow cytometric analysis of CD86 expression after MSU treatment as in Fig. 1 on BM DCs from the indicated KO or control mice. I. Similar to Fig. 4A except that latex tips were used in place of MSU tips, with or without (7) indicated MBCD (6), cyto B (10), SU6656 (7) or Piceatannol (5).
Fig 5
Fig 5. MSU crystals directly engage and sort membrane cholesterol
A. NBD (PC and PE) or Bodipy (cholesterol)-labeled lipids were used to label DC2.4 cells and MSU crystals were added to the labeled cells and analyzed under an AFM UV camera. Green arrows indicate the cholesterol sorting upon binding of MSU crystals. Cholesterol distribution on DC2.4 cells with LPS treatment were used as control. Also shown is a larger MSU crystal in contact with a DC2.4 cell to illustrate the cholesterol sorting underneath the crystal (most lipid sorting crystals are small and are only visible under UV when bound to cells). B. Equal amounts of labeled lipids (PE, PC or cholesterol) were used to stain MSU crystals and the stained crystals were analyzed by flow cytometry for the lipid binding. C. Synthetic bilayer plasma membrane with PC alone or with a mixture of PC/cholesterol or PC/sphingolipid was laid on freshly cleaved mica. A MSU cantilever was used to measure the binding forces after a hold of 1, 5, or 30 sec. P values were calculated by the t-test on maximum attraction forces. The black bar among the symbols is the average value for that group.
Fig 6
Fig 6. Synthetic cholesterol in its biological configuration shows directly binds to MSU surface
A. A schematic depiction of the substrates and end products for a modified cholesterol molecule (SW.I.30) suitable for binding to gold coated AFM cantilever in the orientation as in the plasma membrane, and its control in the reverse orientation. B. The binding forces between the AFM tip coated with SW.I.30 by SAM and the control. P values were calculated by the t-test on maximum adhesion forces. The black bar among the symbols is the average value for that group.
Fig 7
Fig 7. One possible/hypothetical scheme of the receptor independent Syk kinase activation
Left: Resting state DC membrane where lipid rafts are dispersed, and Syk recruitment to the inner membrane is limited. Middle: upon MSU binding, a lipid sorting event occurs as a consequence of potential interaction between the crystal surface and cholesterol (this point remains speculative). Such a sorting aggregates raft associated ITAM containing signaling molecules, leading to the recruitment of Syk, which in turn recruits PI3K. Right: Syk/PI3K leads to actin/microfilament and topological membrane changes that resemble phagocytosis, which further allows stronger and larger binding contacts in a manner of self-amplification. Since the binding strength increases without extracellular proteins (Fig. 3D), it remains unknown if the increased affinity is a result of more cholesterol binding or other lipid alterations that permit more intense membrane/solid surface interaction.

Comment in

  • "Dangerous crystals".
    DeFranco AL. DeFranco AL. Immunity. 2008 Nov 14;29(5):670-1. doi: 10.1016/j.immuni.2008.10.005. Immunity. 2008. PMID: 19006690

References

    1. Abram CL, Lowell CA. The expanding role for ITAM-based signaling pathways in immune cells. Sci STKE. 2007:re2. - PubMed
    1. Aderem A, Underhill DM. Mechanisms of phagocytosis in macrophages. Annu Rev Immunol. 1999;17:593–623. - PubMed
    1. Behrens MD, Wagner WM, Krco CJ, Erskine CL, Kalli KR, Krempski J, Gad EA, Disis ML, Knutson KL. The endogenous danger signal, crystalline uric acid, signals for enhanced antibody immunity. Blood. 2008;111:1472–1479. - PMC - PubMed
    1. Brown DA. Lipid rafts, detergent-resistant membranes, and raft targeting signals. Physiology (Bethesda) 2006;21:430–439. - PubMed
    1. Brown DA, London E. Functions of lipid rafts in biological membranes. Annu Rev Cell Dev Biol. 1998;14:111–136. - PubMed

Publication types

MeSH terms